


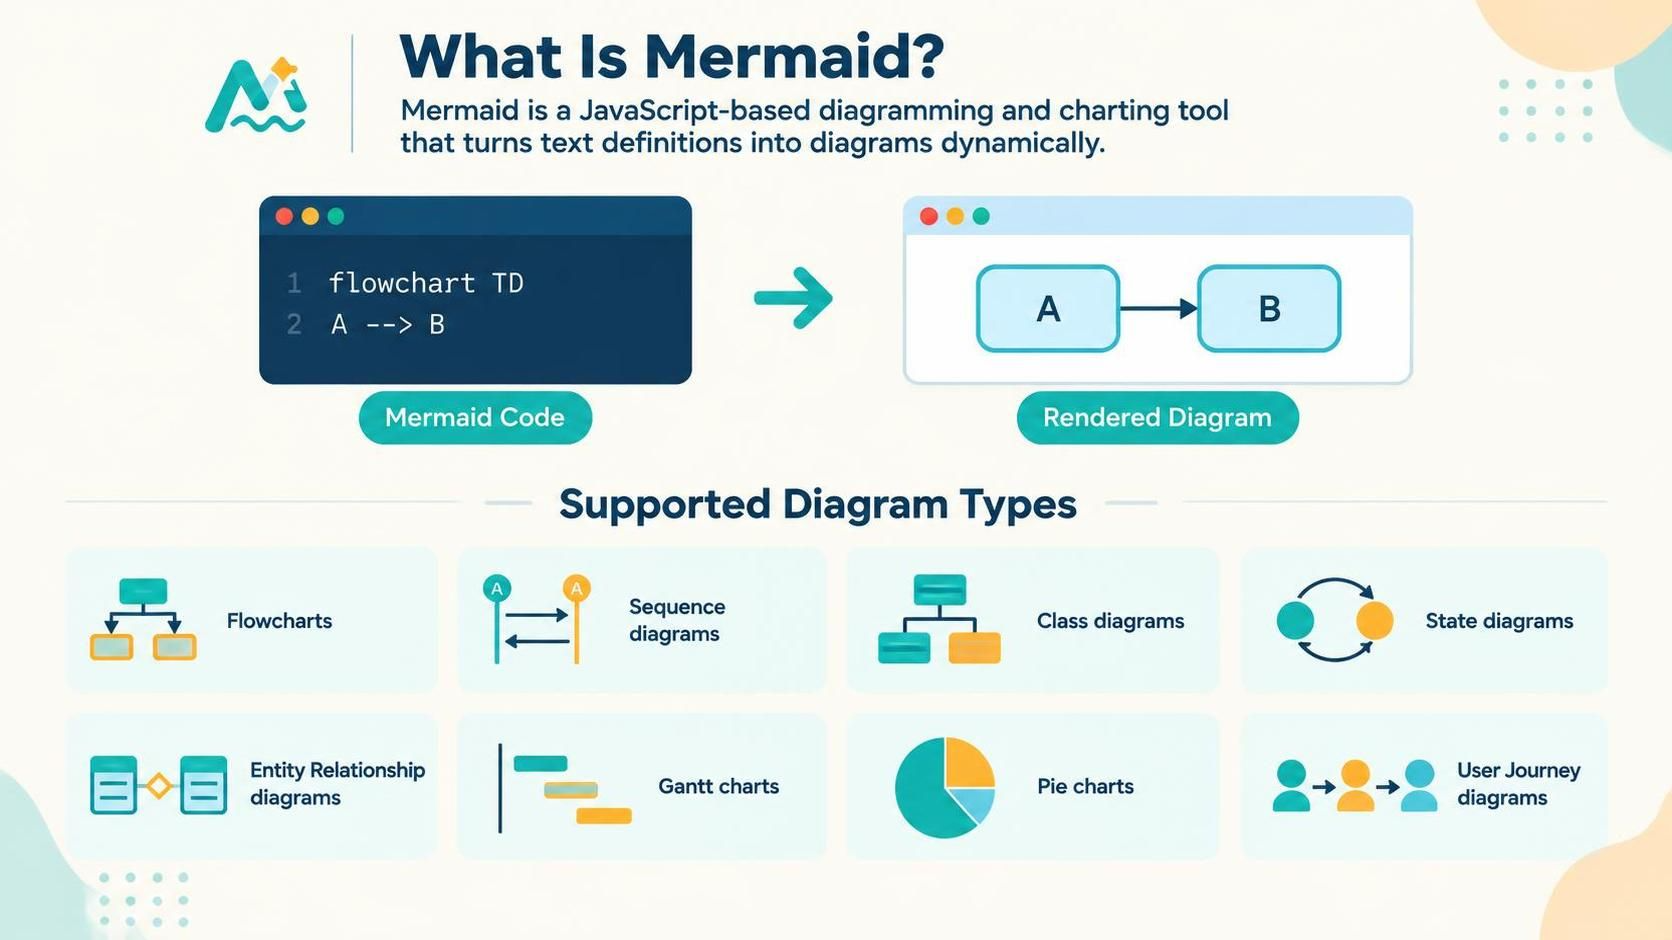
In the rapidly evolving landscape of software development and technical documentation, the “Infrastructure as Code” philosophy has finally reached the realm of visual design. Mermaid is a JavaScript-based diagramming and charting tool that has revolutionized this space by turning text definitions into dynamic, renderable diagrams. Instead of relying on static image files that are difficult to maintain, Mermaid allows developers and architects to write code that automatically generates high-quality visual representations of system logic.
The Paradigm Shift: From Pixels to Text
Traditionally, creating a system architecture diagram required dragging and dropping shapes on a canvas. While intuitive, this method often leads to “spaghetti diagrams” that are difficult to version control or update. If a developer changes a process, they often have to redraw the entire chart manually.
Mermaid solves this by adopting a declarative approach. You write a simple text script, and the tool parses it to generate the layout, styling, and connections. This approach offers several distinct advantages for technical teams:
- Version Control Friendly: Because the source is plain text, it integrates seamlessly with Git. You can track exactly which node was added or removed in a commit history.
- Dynamic Rendering: The diagram updates automatically whenever the text changes, eliminating the “it looks different on my screen” problem.
- Tooling Integration: Modern tools, such as Visual Paradigm VPasCode combined with AI generation, can now translate high-level requirements or natural language prompts directly into Mermaid code, bridging the gap between concept and visualization.
Core Architecture of a Mermaid Diagram
Understanding how Mermaid works is essential before generating complex diagrams. At its core, a Mermaid diagram consists of a definition block and a set of graph definitions. The engine parses the code line-by-line to build a dependency graph.
Consider the fundamental structure used to connect two nodes, which is the building block for complex flowcharts and sequence diagrams. The syntax is designed to be human-readable while remaining machine-parsable.
graph TD
    A[Start Process] --> B{Is Valid?}
    B -- Yes --> C[Generate Output]
    B -- No --> D[Log Error]
In this example, the directive graph TD tells the engine to create a graph flowing Top to Down. The lines A -- Yes --> C define the edges, specifying the direction and the label of the relationship. This text-based logic allows for rapid iteration without needing a mouse.
Exploring the Spectrum of Diagram Types
Mermaid is versatile, supporting a wide array of diagram types that cater to different modeling needs. Whether you are documenting a user journey or planning a release schedule, the tool provides specific syntax for each.
1. Flowcharts and Sequence Diagrams
Flowcharts are the most common use case, ideal for illustrating logical paths in a system. Sequence diagrams, on the other hand, focus on time-based interactions between objects or users. They are crucial for understanding how data flows through a system over time.
sequenceDiagram
    participant User
    participant API
    participant DB

    User->>API: Request Data
    API->>DB: Query Database
    DB-->>API: Return Result
    API-->>User: Display Data
2. Class and State Diagrams
For object-oriented design, Class diagrams define the structure of software systems. State diagrams are vital for modeling the lifecycle of a specific object, showing how it transitions between different states based on events.
3. Entity Relationship (ER) and Gantt Charts
Database architects use ER diagrams to visualize data relationships, ensuring data integrity before implementation. Project managers utilize Gantt charts to map out timelines, dependencies, and milestones, keeping projects on track.
4. Pie and User Journey Diagrams
Mermaid also supports data visualization like Pie charts for reporting, and User Journey diagrams which map out the emotional and experiential path of a user interacting with a product.
Leveraging AI and VPasCode for Modern Modeling
The integration of AI generation tools with the VPasCode environment represents the next frontier in diagramming. Instead of manually typing out the syntax for a complex Gantt chart or a multi-layered architecture, developers can describe their system in natural language. The AI engine interprets the context and generates the correct Mermaid code structure.
This workflow allows technical tutors and architects to focus on the “What” and “Why” of a system, while the tool handles the “How” of the visual representation. It democratizes diagramming, allowing non-technical stakeholders to participate in the architectural discussion by simply describing the flow.
Conclusion
Mermaid is more than just a drawing tool; it is a methodology for managing visual information. By treating diagrams as code, teams can ensure that their documentation remains synchronized with their codebase. Whether you are building a complex state machine or a simple decision tree, the ability to generate diagrams dynamically through text definitions streamlines the entire software development lifecycle.