


Software architecture relies heavily on clear communication. When systems grow complex, static diagrams often fail to convey the dynamic behavior of components working together. This is where the Interaction Overview Diagram becomes essential. It bridges the gap between high-level activity flows and detailed object interactions. By combining elements of activity diagrams and sequence diagrams, this notation provides a structured view of control flow across multiple interactions.
This guide explores the mechanics, design principles, and practical applications of creating these diagrams. We will examine how to structure control nodes, manage complexity, and ensure that technical documentation remains accurate and readable. Whether you are designing a new microservice or refactoring a legacy system, understanding this tool is crucial for effective system modeling.
What is an Interaction Overview Diagram? 🤔
An Interaction Overview Diagram is a type of behavior diagram in the Unified Modeling Language (UML). It serves as a control flow diagram for interactions. While a standard Sequence Diagram focuses on the step-by-step exchange of messages between objects in a specific scenario, an Interaction Overview Diagram allows you to organize multiple sequences into a cohesive whole.
Think of it as a map. The Sequence Diagram shows the detailed conversation between two or more actors at a specific intersection. The Interaction Overview Diagram shows the route taken to get from one intersection to another, deciding which paths to take based on conditions.
Key characteristics include:
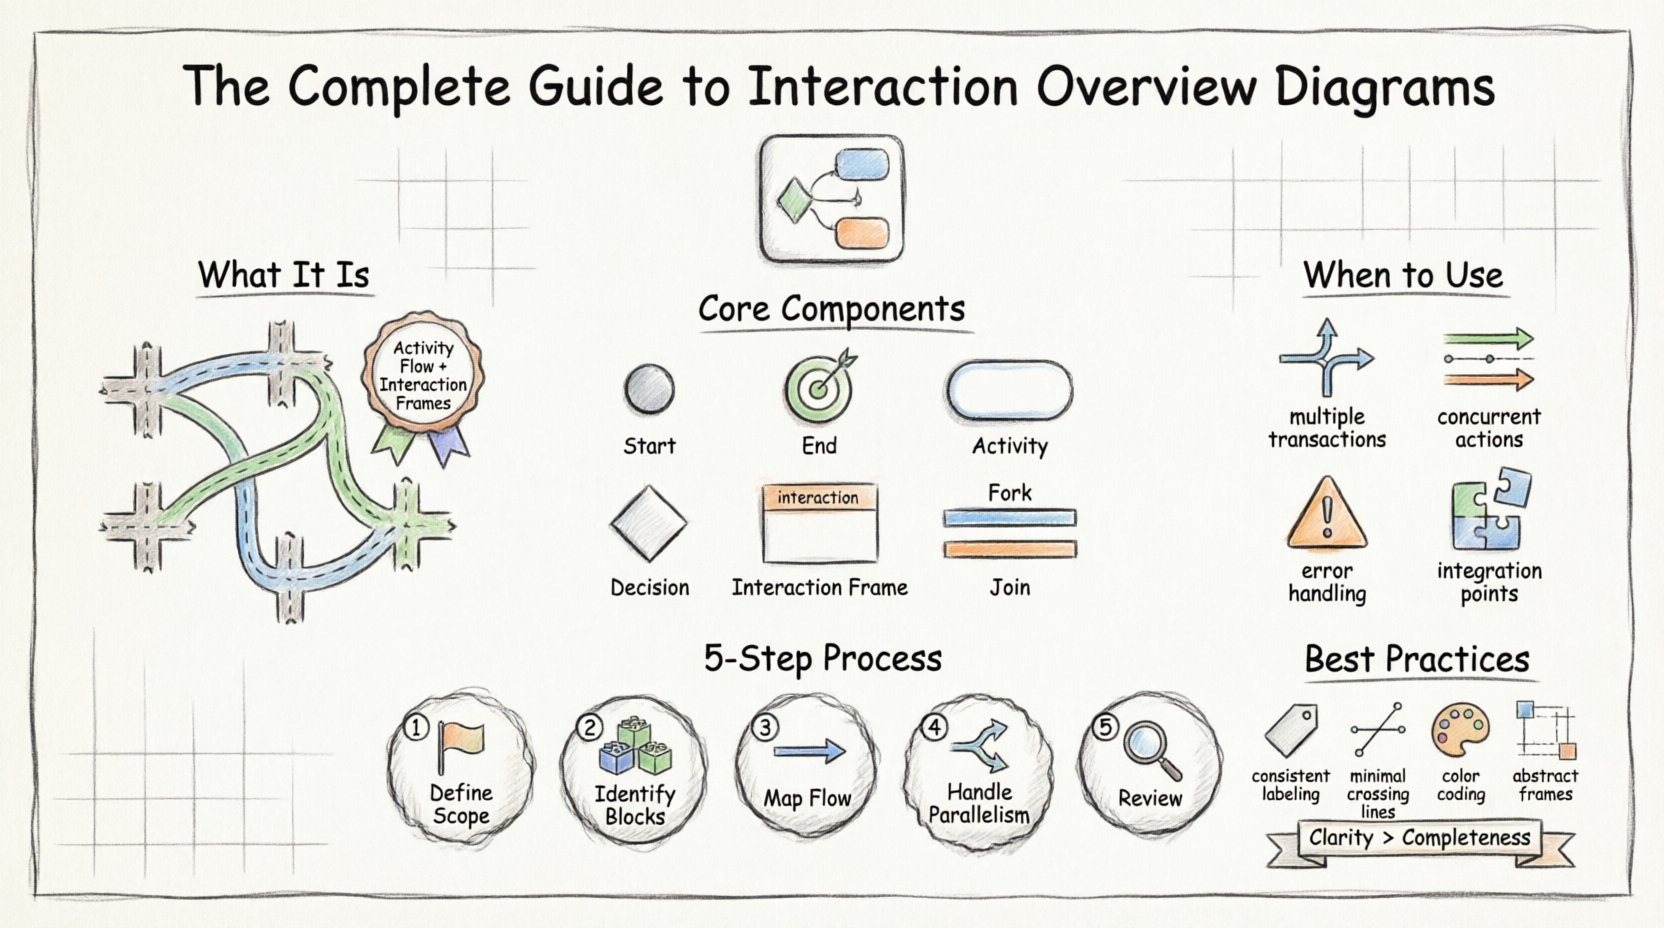
- Hybrid Nature: It integrates activity diagram control flow with interaction frames.
- Control Flow: It manages the order of execution using decision nodes and loops.
- Abstraction: It hides the internal message passing of detailed sequences to focus on the broader process.
- Modularity: Complex interactions can be broken down into reusable frames.
Core Components and Notation 🛠️
To create a meaningful diagram, you must understand the building blocks. Each element has a specific purpose in defining the logic and flow of the system. Using these elements correctly ensures that stakeholders can interpret the diagram without ambiguity.
1. Activity Nodes
These are the primary actions performed within the system. In an interaction context, these often represent the initiation or completion of a specific interaction sequence. They are depicted as rounded rectangles.
- Start Node: A solid circle indicating the entry point of the flow.
- End Node: A bullseye symbol (solid circle inside a hollow circle) marking the termination of a path.
- Activity: Represents a specific step where work is performed or an interaction is triggered.
2. Interaction Frames
This is the defining feature of this diagram type. An interaction frame is a box that encapsulates a specific interaction sequence. It looks like a large rectangle with a tab in the top-left corner labeled interaction.
- References: The frame often references a detailed Sequence Diagram elsewhere in the documentation.
- Content: While the frame can contain internal details, typically it summarizes the outcome of a complex exchange.
- Parameters: Inputs and outputs can be specified to show data flow between interactions.
3. Control Flow Elements
Standard activity diagram elements are used to direct the flow between interaction frames.
- Decision Node: A diamond shape used to branch the flow based on a condition (e.g., success vs. failure).
- Fork and Join: Bars used to split the flow into parallel threads or synchronize them back into a single path.
- Object Node: Represents the creation or consumption of data objects during the process.
When to Use Interaction Overview Diagrams 🧭
Not every process requires this level of detail. Choosing the right notation prevents documentation bloat and confusion. Use this diagram when a single sequence diagram becomes too crowded or when a process involves multiple distinct scenarios.
| Scenario | Recommended Diagram | Reason |
|---|---|---|
| Single transaction flow | Sequence Diagram | Detailed message exchange is needed. |
| Multiple transaction paths | Interaction Overview Diagram | Manages branching logic and scope. |
| High-level business process | Activity Diagram | Focuses on tasks rather than objects. |
| Concurrent system actions | Interaction Overview Diagram | Fork/Join nodes handle parallelism. |
Consider the following situations where this diagram adds value:
- Complex Error Handling: When a process has multiple error paths that need to be visualized alongside the success path.
- State-Dependent Interactions: When the sequence of interactions changes based on the state of the system or user input.
- Integration Points: When multiple external systems need to be coordinated within a single workflow.
- Legacy Documentation: When refactoring existing systems to understand how different modules connect over time.
Constructing the Diagram: A Step-by-Step Process 📝
Building a robust diagram requires a methodical approach. Rushing into drawing often leads to cluttered logic that is hard to maintain. Follow these steps to ensure a structured output.
Step 1: Define the Scope and Entry Point
Begin by identifying the trigger. What initiates the process? Is it a user request, a scheduled task, or an external event? Place the Start Node clearly at the top or left of the diagram. Define the initial context to ground the viewer.
Step 2: Identify Major Interaction Blocks
Break the process down into logical chunks. Do not try to model every message exchange in this diagram. Instead, identify the high-level milestones. For example, in an order processing system, milestones might be:
- Validate Customer
- Check Inventory
- Process Payment
- Generate Invoice
Each of these becomes an interaction frame or an activity node.
Step 3: Map the Control Flow
Connect the blocks using control flow arrows. Decide where branches occur. If a payment fails, does the process stop or retry? Use decision nodes to represent these forks. Label the branches clearly with the condition that triggers them (e.g., “Success”, “Timeout”, “Insufficient Funds”).
Step 4: Handle Parallelism
If actions can happen simultaneously, use fork and join nodes. For instance, sending a confirmation email and updating the database can occur in parallel. Draw a fork bar to split the flow, and a join bar to merge them back together once both are complete.
Step 5: Review and Refine
Walk through the diagram as if you were the system. Start at the beginning and follow every path to an end node. Ensure there are no dead ends where the flow stops without a valid reason. Check that all conditions are accounted for.
Best Practices for Clarity and Readability ✨
A diagram that is difficult to read defeats its purpose. Clarity is more important than completeness. Adhering to these guidelines will improve the quality of your documentation.
1. Limit Depth of Nesting
Do not embed interaction frames inside other interaction frames unless absolutely necessary. Deep nesting creates visual noise and makes tracing the flow difficult. If a sub-process is complex, create a separate diagram and reference it.
2. Consistent Labeling
Ensure all nodes, flows, and frames are labeled consistently. Use the same terminology for objects and actions throughout the document. If a node is called Validate User, do not switch to User Check halfway through.
3. Minimize Crossing Lines
Layout is critical. Arrange nodes to minimize the number of lines that cross each other. Crossing lines create confusion about which path connects to which node. Use orthogonal lines (90-degree angles) rather than diagonal lines for a cleaner look.
4. Use Color for Meaning
While avoiding visual clutter, you can use color to denote specific statuses. For example, red borders for error paths and green borders for success paths can help stakeholders quickly identify critical flows. However, ensure the diagram remains legible in black and white for printing.
5. Keep Frames Abstract
Remember the purpose of the Interaction Overview Diagram. It is not the place for message details. Keep the content inside the interaction frame high-level. Reference the detailed Sequence Diagram for the actual message payload.
Common Pitfalls to Avoid ⚠️
Even experienced modelers can make mistakes that reduce the utility of the diagram. Be aware of these common issues.
- Overloading the Diagram: Trying to show too much detail. If you find yourself writing paragraphs inside a node, it is too detailed.
- Inconsistent Notation: Mixing activity diagram symbols with sequence diagram symbols incorrectly. Stick to UML standards.
- Ignoring Error Paths: Focusing only on the happy path. Real systems fail, and the diagram should reflect how the system recovers.
- Lack of Context: Not defining the actors involved. The viewer should know who or what is interacting with the system.
- Static References: Linking to outdated Sequence Diagrams. Ensure that references remain valid as the code evolves.
Maintaining the Diagram Over Time 🔄
Software documentation is rarely static. As requirements change, the diagram must evolve. Treating the diagram as a living artifact ensures its continued relevance.
Version Control
Store diagram files in the same repository as the code. This allows for easy tracking of changes. When a feature is added or removed, update the diagram simultaneously with the code commit.
Automated Checks
While manual review is necessary, automated tools can check for syntax errors or broken links to referenced diagrams. Regular audits help catch discrepancies before they become significant issues.
Stakeholder Feedback
Share the diagrams with product managers and developers. They can identify logical gaps that technical architects might miss. Feedback loops keep the documentation aligned with actual business logic.
Advanced Techniques for Complex Systems 🚀
For large-scale architectures, standard diagrams may not suffice. Consider these advanced approaches.
Sub-Process Decomposition
Break a large interaction overview into smaller, manageable sub-processes. Each sub-process can have its own interaction overview diagram. Link them together using activity nodes that act as anchors.
Parameter Passing
Clearly define what data moves between interaction frames. Use object nodes to show data creation and consumption. This helps in understanding data dependencies without revealing internal logic.
State Integration
Combine interaction flows with state machine concepts. If a specific interaction is only valid in a certain state, indicate this constraint near the decision node. This prevents invalid transitions in the documentation.
Final Thoughts on Documentation Quality 📝
Creating Interaction Overview Diagrams is about precision and clarity. It is a tool for thinking, not just for drawing. When you draft these diagrams, you are forced to resolve ambiguities in the system logic. This process often reveals gaps in understanding before implementation begins.
Focus on the flow of control. Ensure that every path leads somewhere meaningful. Keep the visual representation clean. By adhering to these standards, you create documentation that serves as a reliable reference for the entire development lifecycle.
The effort invested in high-quality diagrams pays off during troubleshooting and onboarding. New team members can understand the system architecture faster, and existing engineers can trace issues more efficiently. Treat the diagram as a contract between the design and the implementation.
Summary of Key Takeaways 📌
- Hybrid Model: Combine activity flow with interaction sequences.
- Modularity: Use frames to encapsulate complex logic.
- Clarity: Avoid deep nesting and crossing lines.
- Accuracy: Keep diagrams synchronized with system changes.
- Standardization: Follow UML notation rules strictly.
By following these guidelines, you can produce Interaction Overview Diagrams that are both technically accurate and visually accessible. This approach supports better collaboration and reduces the risk of architectural drift in your projects.