


Modern software systems are intricate webs of logic, data flow, and user interaction. As a software architect, your responsibility extends beyond writing code; it involves visualizing how disparate components communicate under varying conditions. While Sequence Diagrams excel at showing object interactions over time, they can become unwieldy when dealing with complex branching logic or high-level workflows. This is where the Interaction Overview Diagram (IOD) becomes essential. 📐
This guide provides a deep dive into the Interaction Overview Diagram. We will explore its notation, its relationship to other Unified Modeling Language (UML) diagrams, and practical strategies for applying it to real-world architecture challenges. By the end, you will understand how to leverage this tool to clarify complex system behaviors without overwhelming your stakeholders. 🚀
📐 What is an Interaction Overview Diagram?
An Interaction Overview Diagram is a type of activity diagram that shows the control flow between interactions. It sits within the broader family of UML behavior diagrams. Think of it as a map that connects different sequence diagrams or communication diagrams into a cohesive story. It is particularly useful when a single interaction diagram cannot capture the full scope of a process.
In simpler terms, while a sequence diagram answers “What happens between these objects at this specific moment?”, an interaction overview diagram answers “How do these specific moments connect to form a larger process?”. It allows architects to model high-level workflows that involve multiple distinct interactions, decision points, and loops.
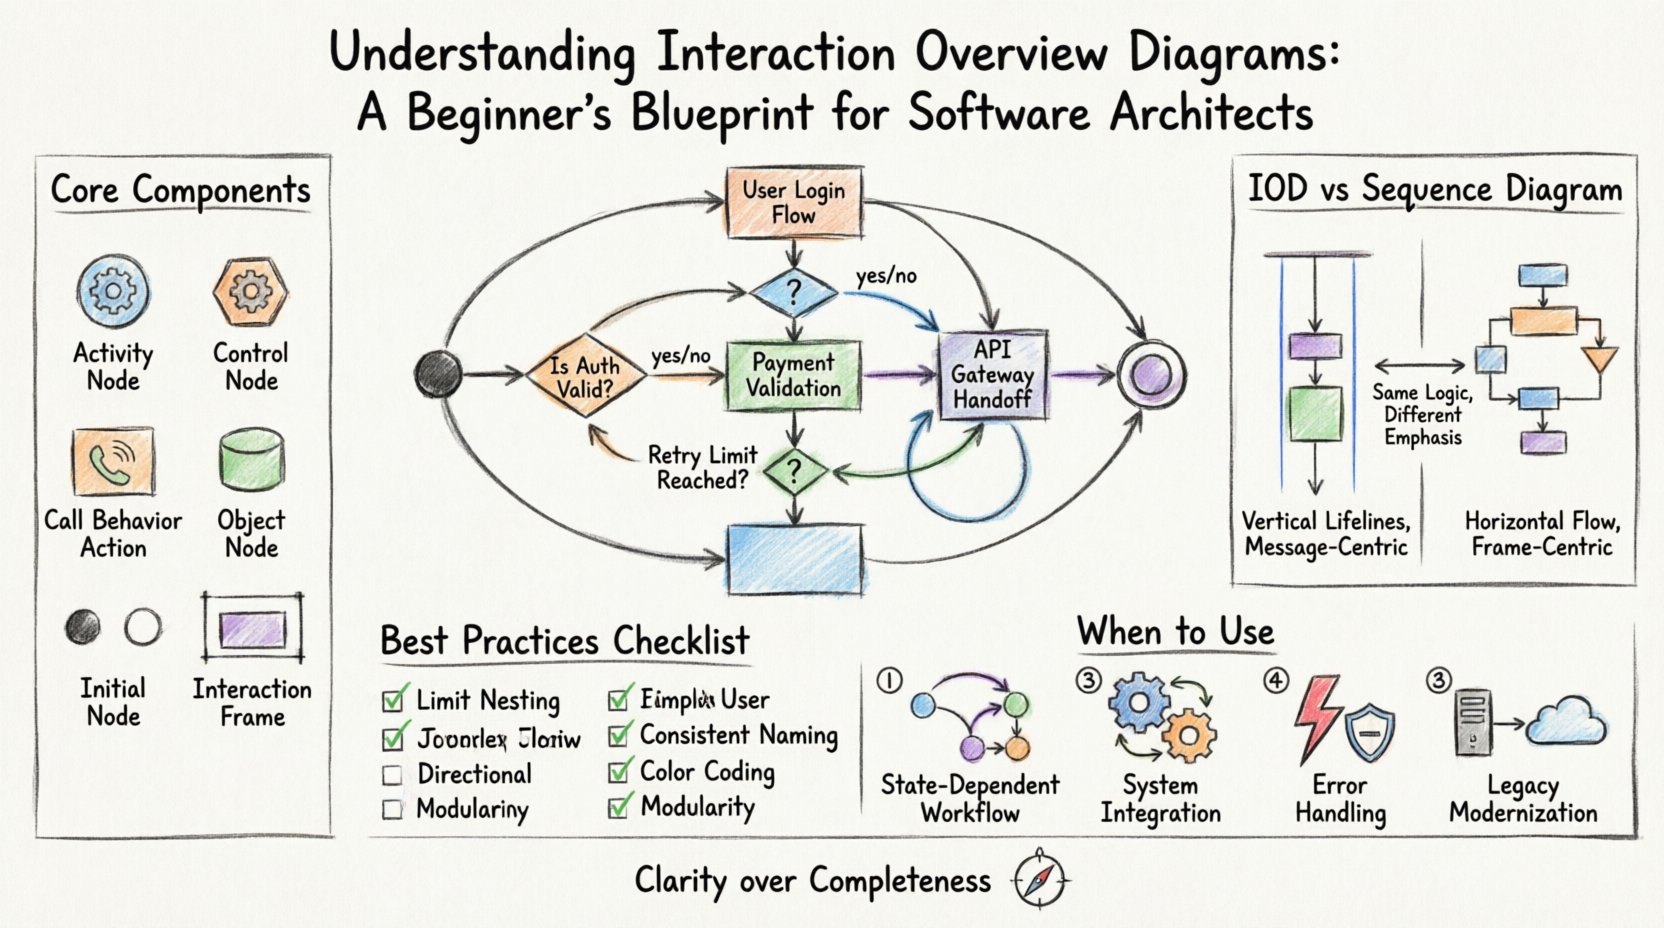
🧩 Core Components and Notation
To create an effective diagram, you must understand the symbols that make up its language. The IOD borrows heavily from activity diagrams but integrates interaction frames. Here are the key elements you will encounter:
- Activity Node: Represents a specific step or action within the workflow.
- Control Node: Acts as a switch, determining the flow of control (e.g., decision diamonds or merge nodes).
- Call Behavior Action: A node that invokes a specific interaction (often represented as a sequence diagram).
- Object Node: Represents the flow of data or objects between interactions.
- Initial Node: The starting point of the workflow (usually a solid black circle).
- Final Node: The end point of the workflow (a solid black circle inside a larger circle).
- Interaction Frame: A large rectangle that encapsulates a specific sequence or communication diagram, labeled as “Interaction”.
These components work together to create a flowchart that respects the temporal ordering of events while maintaining the structural context of the system.
🆚 Interaction Overview vs. Sequence Diagrams
One of the most common questions arises regarding the distinction between Interaction Overview Diagrams and standard Sequence Diagrams. Understanding the difference is critical for choosing the right tool for the job. A Sequence Diagram focuses on the vertical timeline of messages between objects. An Interaction Overview Diagram focuses on the horizontal flow of control between these timelines.
| Feature | Sequence Diagram | Interaction Overview Diagram |
|---|---|---|
| Primary Focus | Message exchange between objects | Control flow between interactions |
| Complexity | Best for linear or simple branching flows | Best for complex workflows with loops and branches |
| Abstraction Level | Low-level, detailed object interaction | High-level, modular interaction management |
| Visual Structure | Vertical lifelines with horizontal arrows | Flowchart style with interaction frames |
| Use Case | Debugging specific API calls or logic steps | Designing user journeys or system states |
When the logic becomes too deep to follow vertically, the Interaction Overview Diagram provides the necessary horizontal perspective to maintain clarity.
🎯 When to Use This Diagram Type
Not every architecture needs an Interaction Overview Diagram. Using it indiscriminately can clutter your documentation. However, there are specific scenarios where this diagram type offers significant value:
- Complex User Journeys: When a user action triggers multiple backend processes that occur in different orders based on conditions.
- State-Dependent Workflows: When the path of execution changes significantly based on the current state of the system.
- System Integration: When coordinating interactions between multiple subsystems or third-party services.
- Error Handling Logic: When you need to visualize retry loops, fallback mechanisms, and exception paths alongside the happy path.
- Legacy Modernization: When mapping out the transition flow from old interaction patterns to new ones.
Identifying these triggers helps you decide when to invest time in modeling the interaction overview rather than relying solely on text descriptions or isolated sequence diagrams.
🛠️ Step-by-Step Construction Process
Creating a robust diagram requires a methodical approach. Follow this process to ensure your diagram remains readable and useful over time.
- Define the Scope: Determine the start and end points of the interaction. What triggers the process, and what indicates successful completion? Keep the scope tight to avoid confusion.
- Identify Major Interactions: Break the process down into distinct phases. Each phase should correspond to a specific interaction frame (e.g., “Authentication”, “Payment Processing”, “Notification Dispatch”).
- Map the Control Flow: Connect the interaction frames using standard activity diagram flow lines. Use decision nodes to represent conditional logic (e.g., “Is user verified?”).
- Detail the Frames: Open each interaction frame to define the sequence diagram inside. Ensure the entry and exit points of the frame match the flow logic defined in the overview.
- Review for Loops: Check for infinite loops or unreachable nodes. Ensure that every decision point leads to a termination or a valid next step.
📋 Best Practices for Clarity
Readability is the primary metric of success for any architectural diagram. If a developer cannot understand the diagram in five minutes, it is too complex. Adhere to these principles:
- Limit Nesting: Avoid nesting interaction frames inside other interaction frames. If you need this, consider creating a separate diagram for the sub-process.
- Consistent Naming: Use clear, descriptive labels for every node and frame. Avoid abbreviations that are not universally understood within your team.
- Directional Flow: Maintain a general left-to-right or top-to-bottom flow. Avoid crisscrossing lines that force the reader to jump back and forth.
- Color Coding: Use color sparingly to highlight critical paths, error states, or security boundaries. Do not use color for decoration.
- Modularity: Treat each interaction frame as a module. If a frame becomes too dense, extract it into a standalone sequence diagram and reference it.
🚫 Common Pitfalls to Avoid
Even experienced architects can fall into traps when modeling interactions. Be aware of these common mistakes:
- Over-Engineering: Trying to model every single exception path in the main overview diagram. Move detailed error handling to separate diagrams.
- Mixing Concerns: Combining data flow logic with user interface logic in the same diagram. Keep domain logic separate from presentation logic.
- Ignoring Concurrency: Failing to represent parallel processes. If two interactions happen simultaneously, use fork and join nodes correctly.
- Static Representation: Creating a diagram that does not reflect the actual dynamic behavior of the system. Update the diagram whenever the logic changes.
🔗 Integrating IODs into Your Design Workflow
An Interaction Overview Diagram does not exist in isolation. It is part of a larger ecosystem of design artifacts. To maximize its utility, integrate it with other diagram types:
- Class Diagrams: Ensure the objects referenced in your interaction frames actually exist in your class structure.
- State Machine Diagrams: Use state diagrams to define the conditions for transitions between interaction frames.
- Component Diagrams: Map the interaction frames to specific components or services in your architecture to verify deployment feasibility.
- Use Case Diagrams: Link high-level use cases to the interaction overview to show how specific scenarios are implemented.
This integration ensures that your visual models align with your codebase and infrastructure plans. It creates a single source of truth for the system’s behavior.
🔄 Maintenance and Evolution
Software architecture is not static. Requirements change, and systems evolve. An Interaction Overview Diagram that is accurate today may be obsolete tomorrow. Establish a maintenance routine:
- Version Control: Store your diagram files in the same repository as your code. Track changes alongside code commits.
- Review Cycles: Include diagram reviews in your sprint planning or architectural decision records. Ensure stakeholders validate the flow logic.
- Refactoring Triggers: If you find yourself constantly updating the diagram to reflect code changes, consider simplifying the diagram or breaking it into smaller units.
- Documentation Linking: Link the diagram to relevant technical specifications. Do not let the diagram become a standalone artifact without context.
📝 Summary of Value
The Interaction Overview Diagram is a powerful asset for software architects facing complex system behaviors. It bridges the gap between high-level workflow design and low-level object interaction. By mastering its notation and applying it strategically, you can reduce ambiguity in your designs and improve communication with development teams.
Remember that the goal is clarity, not completeness. A diagram that is easy to understand is worth more than one that attempts to show everything. Use this tool to illuminate the path through your system’s logic, ensuring that every stakeholder shares a common understanding of how the software functions. 🧭