


Understanding how different parts of a system communicate is essential for building reliable software. The interaction overview diagram serves as a high-level map for these communications. It bridges the gap between static structure and dynamic behavior. This guide provides a detailed walkthrough of what this diagram represents, how to construct one, and how to interpret the flow of control within complex processes. We will focus on the visual language and logical structure without referencing specific tools or products.
What is an Interaction Overview Diagram? 📊
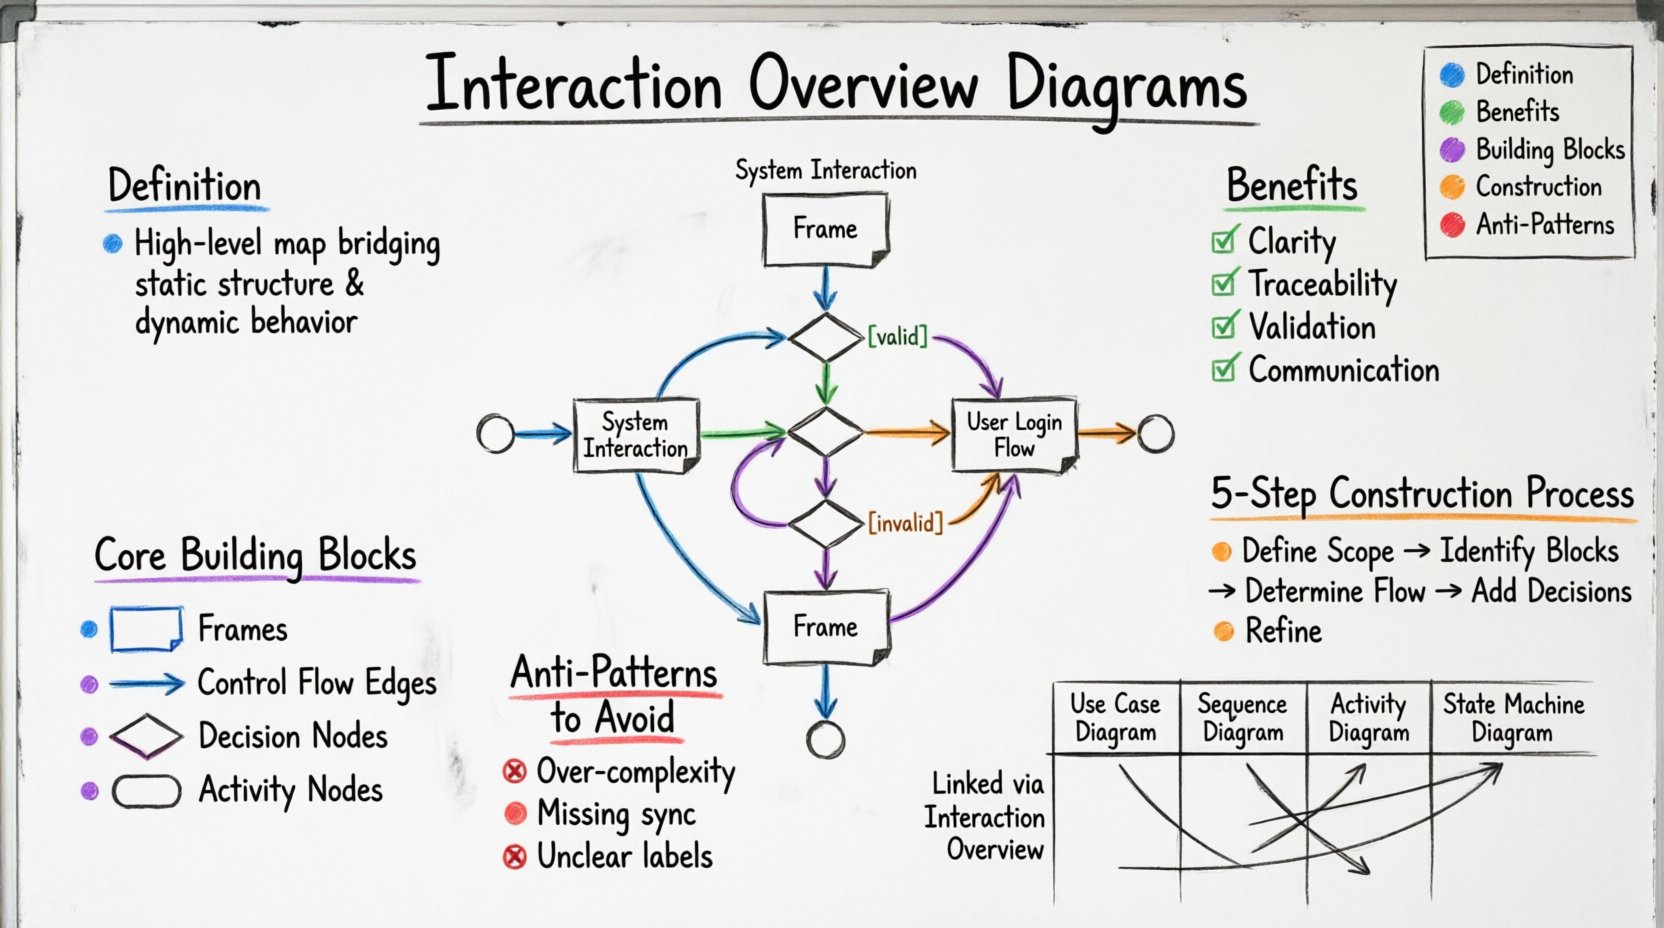
An interaction overview diagram is a type of behavioral diagram. It combines elements of activity diagrams and interaction diagrams. The primary purpose is to show the control flow between interaction diagrams. Think of it as a storyboard for a system’s logic. It does not detail every single message exchange but rather highlights the major decision points and the sequence of major interaction blocks.
Key characteristics include:
- High-Level View: It abstracts away the fine-grained details of individual messages.
- Control Flow: It uses standard flowchart symbols to dictate the order of execution.
- Nested Contexts: It uses frames to encapsulate specific interaction scenarios.
- Decision Logic: It includes branches for conditional paths within the system.
When modeling a system, you often start with use cases. These tell you what the system does. Then you move to sequence diagrams to see how objects talk. The interaction overview sits above these. It tells you the order in which you should look at those sequence diagrams. It creates a narrative arc for the system’s operation.
Why Use This Diagram? 🤔
Complex systems often suffer from a lack of clarity. Developers may know the code, but they might not see the big picture. This diagram helps stakeholders understand the flow without getting lost in syntax. It answers questions like: What happens first? When does the system branch? Where is the error handling?
Benefits of using this approach include:
- Clarity: Reduces cognitive load by grouping related interactions.
- Traceability: Links high-level logic to specific interaction details.
- Validation: Helps identify missing paths or dead ends in the logic.
- Communication: Serves as a common language between architects and developers.
Core Building Blocks 🔧
To read or create these diagrams effectively, you must understand the symbols. The visual language is consistent with standard activity modeling, adapted for interaction contexts.
1. Frames
A frame is a rectangle that encloses an interaction diagram. It acts as a container. Inside the frame, you see the specific sequence of messages for that part of the process. The frame itself is named, often with the name of the interaction it represents. This allows the overview diagram to reference the detailed view without cluttering the main flow.
2. Control Flow Edges
These are arrows connecting the frames and activities. They indicate the order in which the interaction blocks are executed. Unlike data flow, this is strictly about control. An arrow points from the end of one block to the start of the next. It implies that the previous block must finish before the next begins.
3. Decision Nodes
Decision nodes are diamond shapes. They represent a point where the path splits based on a condition. For example, if a login attempt fails, the flow might go to an error frame. If it succeeds, it goes to a dashboard frame. Each outgoing edge from a decision node must have a guard condition labeled on it, such as [valid] or [invalid].
4. Activity Nodes
These are small circles or rounded rectangles. They represent a specific action or a call to another activity. In the context of an overview, they often represent the start or end of a specific interaction block. They help anchor the flow before entering a frame.
Step-by-Step Construction Process 🛠️
Creating a robust interaction overview requires a methodical approach. You cannot simply draw lines randomly. There is a logical progression to follow to ensure accuracy.
Step 1: Define the Scope
Start by identifying the main use case or scenario you are modeling. Is this the entire system lifecycle, or just a specific module? Define the entry point and the exit point. The diagram should have a single start node and at least one end node.
Step 2: Identify Major Interaction Blocks
Break the scenario down into major phases. Instead of drawing every message, group them into logical chunks. For example, “Authentication,” “Data Retrieval,” and “Display Results.” These chunks will become the frames in your diagram.
Step 3: Determine Control Flow
Draw arrows between the blocks. Ask yourself: What must happen before this block can start? Does this block depend on the result of the previous one? Ensure there are no cycles unless they are intentional loops.
Step 4: Add Decision Points
Insert decision nodes where logic changes. Consider error states, user cancellations, or conditional data availability. Label the paths clearly. A path without a label is ambiguous and should be avoided.
Step 5: Refine and Review
Check for orphaned paths. Ensure every decision node has an exit. Verify that the frames correspond to existing detailed interaction diagrams. Clean up the layout to minimize crossing lines.
Reading the Flow 🧐
Once the diagram is created, the team needs to understand how to read it. Reading is as important as writing. Misinterpretation can lead to implementation errors.
- Follow the Arrows: Start at the initial node. Trace the path to the end. Do not skip steps.
- Check Guard Conditions: Look at the labels on the arrows leaving decision nodes. Do they cover all possibilities?
- Enter Frames: When you encounter a frame, pause. This is where the detailed sequence happens. You may need to look at a separate diagram for the full message list.
- Identify Loops: If a path circles back, check the condition. Does it terminate? Infinite loops are a common logical error.
Visual Example of Flow
Imagine a request for data. The flow starts at Start. It moves to a Decision Node. If the user is authenticated, it goes to Login Frame. If not, it goes to Auth Frame. After authentication, both paths converge at a Join Node. Then it moves to Data Fetch Frame. Finally, it reaches the End node. This structure ensures that data is only fetched after identity is verified.
Common Patterns and Anti-Patterns ✅❌
Certain structures appear frequently in system modeling. Recognizing these helps in validation.
Valid Patterns
- Sequential Execution: Blocks run one after another.
- Parallel Split: One path splits into multiple frames that run concurrently. (Requires synchronization).
- Conditional Branching: Logic determines the path.
Common Mistakes
- Over-Complexity: Putting too much detail inside the overview. Remember, this is a high-level map.
- Missing Synchronization: If you split a path, you usually need to join it back later. Leaving paths open creates ambiguity.
- Unclear Labels: Using vague terms like “Process Data” instead of “Validate User Input”.
Integration with Other Models 🔗
This diagram does not exist in isolation. It is part of a larger ecosystem of diagrams. Understanding how it connects to others is crucial for a complete picture.
| Diagram Type | Relationship to Interaction Overview | Primary Focus |
|---|---|---|
| Use Case Diagram | Provides the scenario context for the overview. | Actor goals and system boundaries. |
| Sequence Diagram | Provides the detailed message flow inside each frame. | Time-ordered message exchange. |
| Activity Diagram | Similar structure, but focuses on workflow rather than interactions. | Task execution flow. |
| State Machine Diagram | Can show the state changes triggered by the interactions. | Object lifecycle and states. |
When the overview diagram references a frame, the corresponding sequence diagram must exist. If you create a frame without a detailed view, the diagram is incomplete. This linkage ensures that the high-level logic can be traced down to the implementation details.
Advanced Considerations 🚀
As systems grow, the diagrams must evolve. There are nuances to consider when dealing with large-scale architectures.
Handling Concurrency
Modern systems often process multiple tasks at once. You may need to show parallel paths. Use bars across the flow to indicate parallel execution. Ensure you have a synchronization bar to merge the paths before proceeding. This prevents race conditions in the logic.
Exception Handling
Things go wrong. A good diagram accounts for failure. Create specific frames for error handling. For example, if the database connection fails, route the flow to a “Retry” or “Alert” frame. This makes the system’s resilience visible.
Refinement Levels
Not all diagrams need the same level of detail. You might have a Level 1 overview that shows the entire system. Then a Level 2 overview that drills down into a specific module. This hierarchy helps manage complexity.
Analysis and Optimization 📈
Once a diagram is built, it can be used for analysis. You can look for inefficiencies or bottlenecks.
Identifying Bottlenecks
Look for points where many paths converge. If too much flow passes through a single frame, that part of the system might become a bottleneck. Consider splitting the frame or adding parallel processing.
Reducing Complexity
If a frame is too complex, it defeats the purpose of the overview. Break it down. Create a sub-overview for that frame. This keeps the main diagram clean and readable.
Summary of Key Elements 📝
To recap, here are the essential takeaways for working with this visual model.
- Structure: Use frames to group interactions.
- Flow: Use arrows to show control direction.
- Logic: Use decision nodes for conditions.
- Detail: Link frames to detailed sequence diagrams.
- Clarity: Label all paths and decisions clearly.
By adhering to these principles, you create a model that is both accurate and useful. It serves as a reliable reference for development and testing.
Practical Application Guide 🛠️
How do you apply this in a real workflow? Follow this checklist.
- Gather Requirements: Understand the user story.
- Sketch the Flow: Draw the high-level blocks on paper.
- Refine the Logic: Add decision nodes and conditions.
- Map to Details: Ensure every frame has a sequence diagram.
- Review with Team: Walk through the diagram with developers.
- Update Iteratively: Change the diagram as the system changes.
Documentation is a living artifact. It should change as the code changes. Keeping the diagram up to date is the responsibility of the team. Outdated diagrams lead to confusion and technical debt.
Conclusion on Visual Modeling 🎯
Effective modeling is about communication. The interaction overview diagram is a powerful tool for that communication. It allows you to see the forest and the trees. By focusing on control flow and logical grouping, you create a blueprint that guides the development process. It reduces ambiguity and aligns the team on the system’s behavior. Use it to clarify, validate, and document the dynamic aspects of your architecture.
Remember that the goal is understanding. If a stakeholder cannot read the diagram, it has failed. Keep it simple. Keep it accurate. Keep it visible.