


In the landscape of software design and user experience architecture, clarity is paramount. When teams attempt to build complex systems, the path a user takes through an application must be mapped with precision. This is where the Interaction Overview Diagram (IOD) becomes a critical asset. Unlike static wireframes, an IOD provides a dynamic representation of the logic and flow within a system, bridging the gap between high-level strategy and detailed implementation.
Understanding how to construct and interpret these diagrams allows designers and developers to anticipate user behavior, identify bottlenecks, and ensure that the final product aligns with intended functionality. This guide explores the mechanics of Interaction Overview Diagrams, their role in user flow visualization, and the methodologies used to create effective visual models.
🧩 What Is an Interaction Overview Diagram?
An Interaction Overview Diagram is a type of diagram in the Unified Modeling Language (UML). It serves as a high-level view of a system’s behavior, focusing on the interaction between different components or activities. While a sequence diagram details the step-by-step exchange of messages between objects, an IOD zooms out to show the control flow.
Think of it as a flowchart for software logic. It combines elements of activity diagrams and interaction diagrams to illustrate how a system responds to various triggers. For UX professionals, this translates to understanding the journey a user undertakes when completing a specific task, such as registering an account or purchasing a product.
Key characteristics include:
- High-Level Abstraction: It does not get bogged down in every single object message, but rather focuses on the major phases of interaction.
- Control Flow: It explicitly shows the order of operations, including decisions, loops, and parallel activities.
- Modularity: It allows designers to encapsulate complex interactions into sub-flows that can be referenced elsewhere.
- Visual Logic: It provides a visual syntax that reduces ambiguity during development handoffs.
🔍 Anatomy of the Interaction Overview Diagram
To utilize an IOD effectively, one must understand its constituent parts. These elements work together to create a coherent narrative of system behavior.
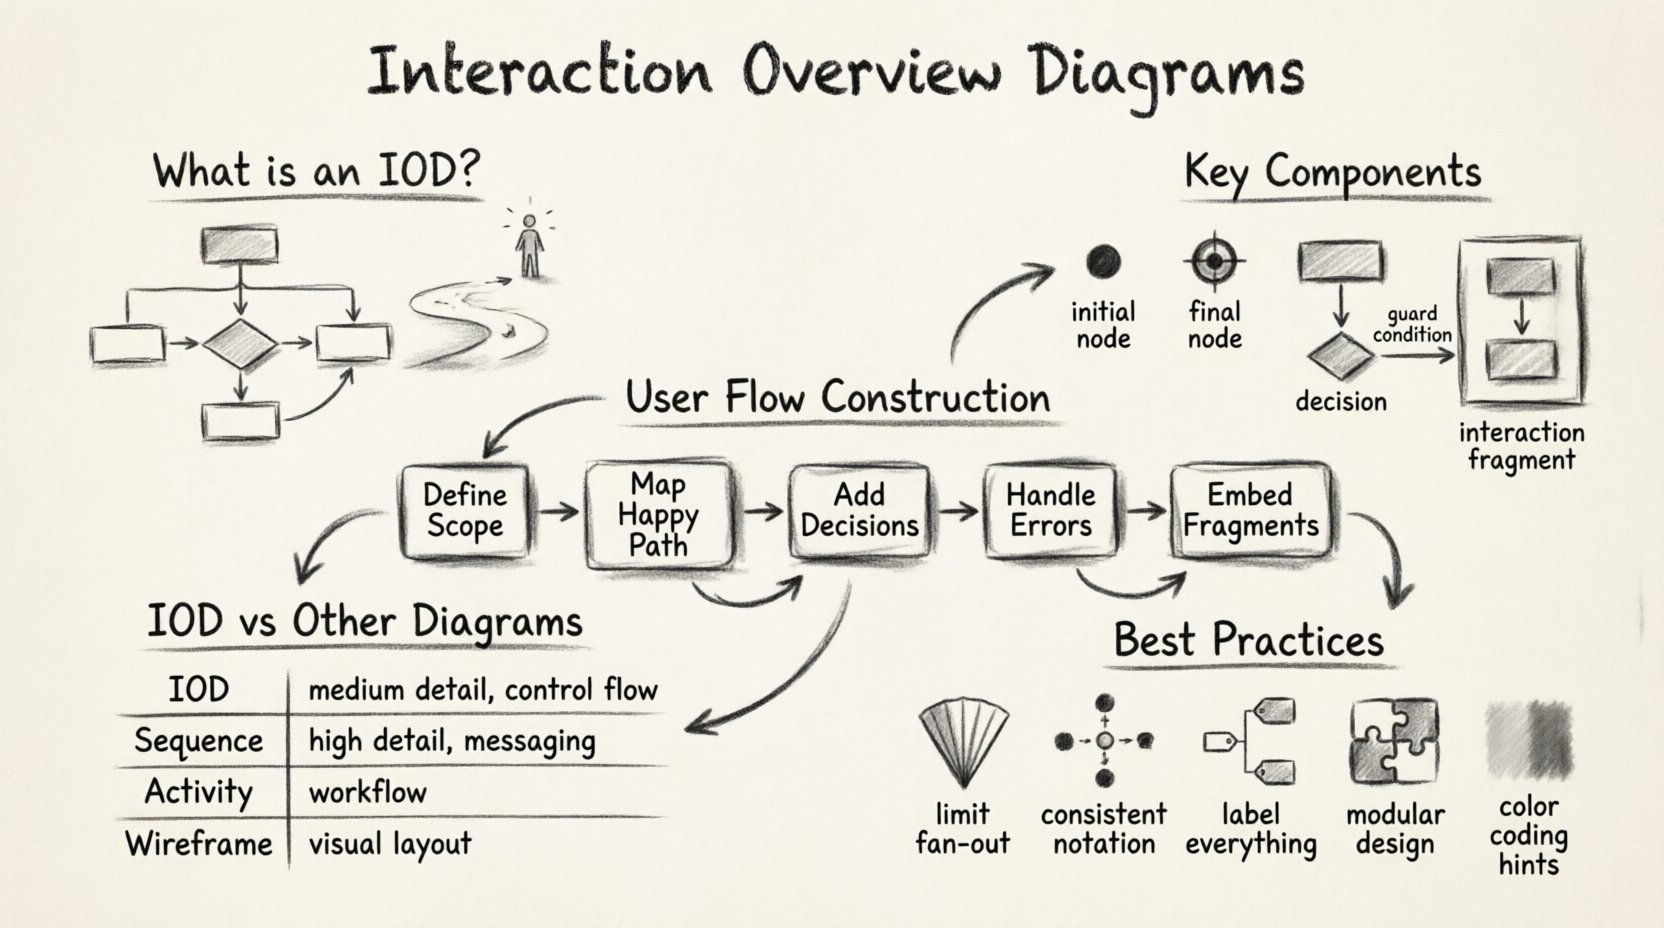
1. Initial and Final Nodes
Every flow requires a starting point and an ending point. The initial node is represented by a solid circle, indicating where the process begins. The final node is a bullseye symbol (a solid circle within a larger circle), marking the termination of the interaction. These anchor the user journey within the diagram.
2. Activity Nodes
Activity nodes represent specific actions or states within the system. These are the “doing” parts of the diagram. In a user flow context, an activity node might represent a screen load, a data validation process, or a server request. They are the building blocks of the user experience.
3. Control Flow Edges
These are the arrows connecting the nodes. They dictate the direction of the flow. Unlike simple flowcharts, control flow edges in UML can carry guards (conditions) that determine which path the system takes based on data.
4. Decision and Merge Nodes
Decision nodes (diamonds) introduce logic. Here, the flow splits based on a condition. For example, if a user enters the correct password, the flow proceeds to the dashboard. If not, it merges with the error handling path. Merge nodes bring these paths back together.
5. Interaction Fragments
One of the most powerful features of an IOD is the ability to embed other interaction diagrams. A large box within the IOD can represent a complex sequence of events that are detailed elsewhere. This keeps the main diagram clean while preserving depth.
⚖️ Comparison: IOD vs. Other Modeling Diagrams
Choosing the right visualization tool depends on the specific problem being solved. An Interaction Overview Diagram is not a replacement for all other diagrams but complements them.
| Diagram Type | Primary Focus | Best Used For | Level of Detail |
|---|---|---|---|
| Interaction Overview Diagram (IOD) | Control flow and high-level logic | Mapping user journeys and system states | Medium |
| Sequence Diagram | Object messaging and timing | Backend logic and API interactions | High |
| State Machine Diagram | System states and transitions | Complex object lifecycle management | High |
| Activity Diagram | Workflow and processes | Business logic and general processes | Medium to High |
| Wireframe | UI layout and visual design | Screen design and aesthetics | Low (Visual) |
When designing a user flow, the IOD sits comfortably between the abstract business logic of an activity diagram and the technical specifics of a sequence diagram. It answers the question: “What happens next?” without requiring the team to model every single API call immediately.
🛠️ Constructing a User Flow with IOD
Creating an effective Interaction Overview Diagram requires a methodical approach. It is not enough to draw lines between boxes; the logic must be sound.
Step 1: Define the Scope and Entry Point
Start by identifying the specific user goal. Is this the login process? The checkout flow? The onboarding sequence? Clearly define the entry point. In an IOD, this is the initial node. Ensure that the starting condition is met before the diagram begins.
Step 2: Map the Primary Path
Draw the “happy path” first. This is the ideal scenario where the user completes the task without errors or interruptions. Connect the activity nodes that represent the necessary screens or actions. Keep this linear to establish the baseline flow.
Step 3: Identify Decision Points
Where can the user diverge from the primary path? Common decision points include:
- Authentication: Valid vs. Invalid credentials.
- Form Validation: Missing fields vs. Complete data.
- System Errors: Network timeout vs. Server success.
- User Choice: Cancel vs. Continue.
Represent these as decision diamonds. Assign guards to each outgoing path to clarify the condition.
Step 4: Handle Error States
A robust system accounts for failure. Map out what happens when things go wrong. Does the user get an error message? Are they redirected to a help page? Do they have the option to retry? These branches must loop back into the flow or lead to a termination node.
Step 5: Integrate Complex Interactions
If a specific interaction is too detailed for the main overview, create a nested interaction fragment. This could be a sequence diagram showing the data exchange for a specific button click. Reference this fragment in the IOD to maintain clarity without losing technical detail.
🚦 Decision Points and Branching Logic
Branching logic is where the IOD truly shines in visualizing user flows. It allows stakeholders to see potential outcomes before a single line of code is written.
Consider the following scenarios:
- Conditional Access: If a user has a premium subscription, the flow branches to exclusive content. Otherwise, it branches to a pricing page.
- Concurrency: Some processes happen in parallel. For example, when a user submits a form, the system might simultaneously validate the input and send a notification email. The IOD can show these parallel threads using fork and join nodes.
- Time-Based Events: Some interactions depend on time. If a user does not complete a step within 10 minutes, the session expires. This can be modeled as a timeout guard on a control flow edge.
By explicitly modeling these branches, teams can ensure that edge cases are not overlooked. This is particularly important for accessibility and error handling, ensuring that users are not left in dead-end states.
🔄 Feedback Loops and Error Handling
User flows are rarely linear. Feedback loops are essential for systems that require multiple iterations to reach a goal. For instance, a search query might return no results, prompting the user to refine their search. This creates a loop back to the search input activity.
Key considerations for feedback loops:
- Clarity: The loop must be visually distinct. Use clear labels on the return path.
- Limitations: Prevent infinite loops. Define a maximum number of iterations or a timeout condition.
- User Agency: Ensure the user can exit the loop if they choose to abandon the task.
Error handling should not be an afterthought. In the IOD, error paths should be as visible as success paths. This forces the design team to think about recovery strategies. Does the system auto-save data before an error occurs? Is there a way to recover from a network failure without losing input?
📊 Best Practices for Clarity
A diagram that is too complex defeats its purpose. The goal is communication, not decoration. Adhere to these principles to maintain readability.
- Limit Fan-Out: Avoid having too many outgoing edges from a single decision node. If there are more than three options, consider grouping them or splitting the logic.
- Use Consistent Notation: Stick to standard UML symbols. Do not create custom shapes that confuse readers.
- Label Everything: Every edge should have a guard condition if it represents a choice. Every node should have a descriptive name.
- Group Related Activities: Use activity partitions or swimlanes to show which component or user role is responsible for each step.
- Keep It Modular: If a flow becomes too long, break it into smaller sub-diagrams. Reference the sub-diagrams rather than cramming everything onto one canvas.
- Color Coding: While avoiding CSS styling for the final output, using distinct colors for different types of nodes (e.g., green for success, red for error) can aid quick comprehension during presentations.
🧱 Integration into Development Workflows
An Interaction Overview Diagram is not just a design artifact; it is a functional specification. It must integrate smoothly into the development lifecycle.
Collaboration Between Roles
Designers use the IOD to validate user journeys. Developers use it to understand system logic. Product Managers use it to verify feature coverage. Because the IOD is language-agnostic, it serves as a common ground for these different stakeholders.
Documentation and Versioning
As the product evolves, the user flow will change. It is essential to version control these diagrams alongside the codebase. When a feature is updated, the corresponding IOD should be reviewed and modified. This ensures that the documentation remains a source of truth.
Automated Testing
In advanced workflows, the logic defined in the IOD can inform automated testing scripts. The decision nodes and guards can be translated into test cases. For example, if a guard condition is “user is logged in,” a test case should verify behavior both when the condition is true and false.
📈 Maintenance and Version Control
Diagrams rot. Just like code, they become outdated if not maintained. Regular audits of the Interaction Overview Diagrams are necessary.
- Review Cycles: Schedule periodic reviews during sprint planning or release planning.
- Change Tracking: Mark changes clearly. Use version numbers or commit hashes to reference specific iterations.
- Deprecation: If a feature is removed, the corresponding nodes should be marked as deprecated or removed entirely to prevent confusion.
- Feedback Loop: Encourage developers and QA engineers to flag discrepancies between the diagram and the actual application behavior.
🎯 Measuring Diagram Utility
How do you know if the Interaction Overview Diagram is effective? The metrics are qualitative but measurable.
- Reduced Ambiguity: Fewer questions during the development handoff.
- Faster Onboarding: New team members understand the system flow more quickly.
- Bug Reduction: Fewer edge-case bugs because error paths were pre-planned.
- Alignment: Stakeholders agree on the logic before implementation begins.
When these indicators improve, the investment in creating and maintaining these diagrams is validated. It transforms the user flow from an abstract concept into a concrete blueprint.
🔗 The Future of Flow Visualization
As systems become more complex, the need for clear visualization tools grows. While Interaction Overview Diagrams have been a staple of UML for decades, their application in modern UX design is expanding. With the rise of component-based architecture and micro-frontends, understanding how different parts of an interface interact is more critical than ever.
Combining IODs with other modern visualization techniques, such as state machines for frontend logic or event-driven architecture diagrams, creates a comprehensive map of the digital product. This holistic view ensures that the user experience remains consistent, regardless of the underlying technical complexity.
📝 Final Thoughts
Visualizing user flows is not merely about drawing lines; it is about defining logic. The Interaction Overview Diagram provides a structured way to capture that logic. It forces the team to think about the “what ifs” before they become bugs. By adhering to standard notation, maintaining clarity, and integrating these diagrams into the development process, teams can build systems that are robust, predictable, and aligned with user needs.
The effort required to create and maintain these diagrams pays dividends in reduced rework and clearer communication. In the end, a well-constructed Interaction Overview Diagram is a testament to a thoughtful design process, ensuring that the final product delivers value without unnecessary friction.