


In the landscape of software development, complexity is the only constant. As systems grow, the communication gap between high-level strategy and low-level implementation widens. Architects face the challenge of modeling behavior that is too complex for a single sequence diagram but too specific for a high-level activity diagram. This is where the Interaction Overview Diagram (IOD) becomes essential. It serves as a bridge, offering a macro view of interactions while retaining the necessary detail of object behavior.
This guide explores the mechanics of Interaction Overview Diagrams within the Unified Modeling Language (UML) framework. We will examine how to structure these diagrams effectively, when to apply them, and how they fit into the broader ecosystem of technical documentation. By understanding this tool, teams can improve clarity in system design and reduce the cognitive load during code reviews and architectural planning.
Understanding the Interaction Overview Diagram 🧩
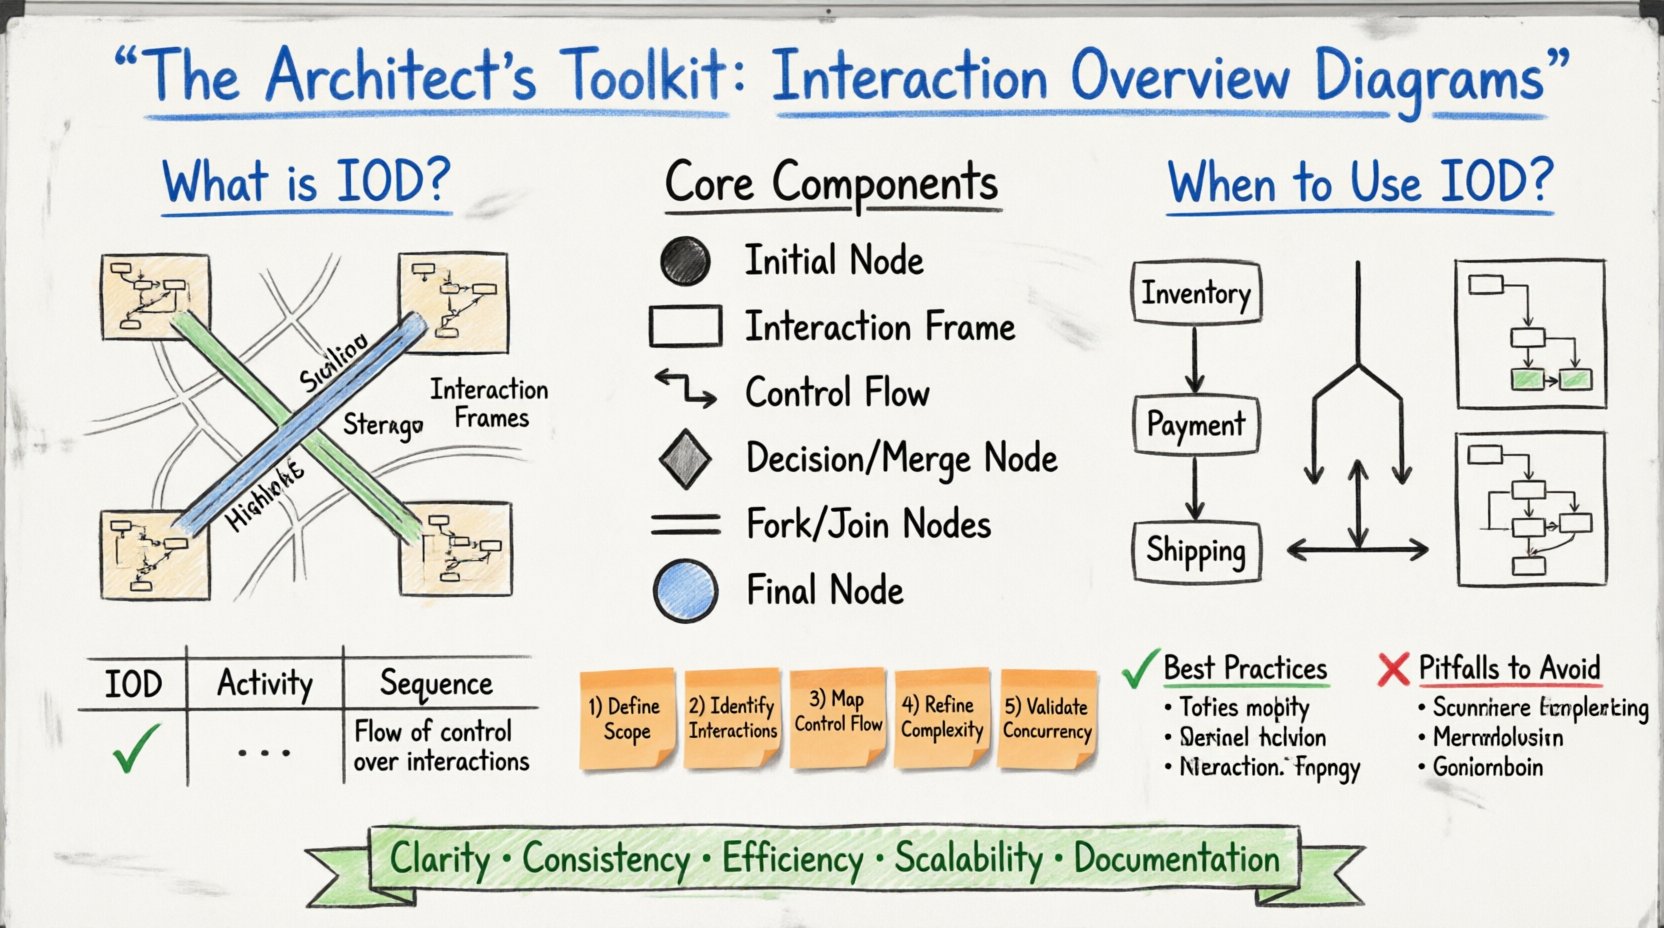
An Interaction Overview Diagram is a type of UML diagram that combines the structure of an activity diagram with the behavior of interaction diagrams. While an activity diagram focuses on the flow of control between activities, an interaction diagram focuses on the flow of messages between objects. The IOD sits in the middle, allowing architects to define the flow of control over a set of interaction diagrams.
Think of it as a map of maps. Instead of showing every single street, you show the major highways connecting different districts. In software terms, instead of listing every message sent between a user and a database, you show the sequence of major steps (e.g., “Login”, “Search”, “Checkout”) and how they connect.
Core Components and Notation 📐
To utilize this diagram effectively, one must understand the specific symbols involved. The IOD uses a subset of activity diagram notation combined with interaction diagram frames.
- Initial Node: Represents the starting point of the interaction flow. It is depicted as a filled circle.
- Interaction Frame: A large rectangle that encloses a specific interaction (like a sequence diagram). This is the most critical element of the IOD.
- Control Flow: The lines connecting the interaction frames, showing the order of execution.
- Decision Node: A diamond shape used to represent a branching point in the logic where the path depends on a condition.
- Merge Node: A diamond shape where multiple control flows converge back into a single path.
- Fork and Join Nodes: Rectangles used to represent parallel execution. A fork splits the flow into multiple concurrent threads, while a join waits for all threads to complete before continuing.
- Object Node: Represents the presence or absence of an object at a specific point in the interaction.
- Final Node: Represents the end of the interaction flow, shown as a circle with a solid border.
Each interaction frame within the diagram typically references a specific sequence diagram or communication diagram. This linkage allows the IOD to abstract the complexity of message passing while maintaining a clear view of the overall process flow.
When to Use an Interaction Overview Diagram 🤔
Not every system design requires an IOD. Over-diagramming can lead to maintenance burdens and confusion. Architects should evaluate the complexity of the workflow before deciding to create one. Below are scenarios where an IOD provides the most value.
Complex Business Processes
When a business process involves multiple subsystems or services, a single sequence diagram becomes unwieldy. For example, an e-commerce checkout might involve inventory checks, payment processing, user notification, and shipping logistics. Each of these could be a separate interaction, but the IOD shows how they chain together.
Parallel Processing
If a system needs to handle multiple tasks simultaneously (e.g., validating a form while fetching user preferences), a standard sequence diagram struggles to show concurrency clearly. The fork and join nodes in an IOD explicitly denote where parallelism begins and ends.
High-Level Workflow Documentation
For stakeholders who do not need to see every message, the IOD offers a simplified view of the system’s logic. It answers the question, “What happens next?” without getting bogged down in the details of “Who sent that specific message?”.
IOD vs. Other Diagram Types 📊
Choosing the right diagram is a critical skill. Confusing an IOD with an Activity Diagram or a Sequence Diagram can lead to architectural ambiguity. The table below clarifies the distinctions.
| Feature | Interaction Overview Diagram | Activity Diagram | Sequence Diagram |
|---|---|---|---|
| Primary Focus | Flow of control over interactions | Flow of control over activities | Flow of messages over time |
| Granularity | Mixed (Frames contain details) | High-level logic steps | Low-level object messages |
| Concurrency | Explicit Fork/Join nodes | Thread bars within activities | Parallel lifelines |
| Best Used For | Orchestrating multiple interactions | Workflows and algorithms | Specific object collaborations |
While Activity Diagrams focus on the state of the system and the steps taken, Interaction Overview Diagrams focus on the collaboration between objects at a higher level. Sequence Diagrams are too detailed for an overview. The IOD bridges this gap.
Constructing an Effective Interaction Overview 🏗️
Creating a diagram is not just about drawing lines; it is about structuring information for clarity. Follow these steps to build an IOD that serves the team effectively.
1. Define the Scope
Before drawing, identify the specific use case or business transaction you are modeling. Is it the “User Registration” flow? Is it the “Order Fulfillment” process? Keep the scope contained. A diagram that tries to show the entire system architecture will become impossible to read.
2. Identify the Main Interactions
Break down the process into major interaction blocks. These blocks should correspond to logical phases. For example:
- Authentication Phase
- Data Retrieval Phase
- Validation Phase
- Response Generation Phase
Each of these phases will become an interaction frame in your diagram.
3. Map the Control Flow
Connect the frames using control flows. Use decision nodes to handle conditional logic. If a user is not authenticated, the flow might branch to a login screen rather than proceeding to data retrieval. Be explicit about these paths.
4. Manage Complexity with Refinement
If a single interaction frame becomes too complex, create a separate Sequence Diagram for it and reference that diagram within the IOD. This technique, known as refinement, keeps the overview clean while preserving detail where needed.
5. Validate Concurrency
If your process involves parallel tasks, ensure you use Fork and Join nodes correctly. A Fork splits the flow into concurrent activities. A Join waits for all concurrent activities to complete before the flow continues. Misusing these nodes can imply incorrect execution timing.
Best Practices for Maintenance 🛡️
Diagrams are often the first things to go out of date when code changes. To prevent documentation decay, adopt the following practices.
- Link Diagrams to Code: Where possible, associate diagram elements with specific modules or classes. This helps developers locate the relevant code when a diagram element is modified.
- Version Control: Treat diagrams as code. Store them in the same repository as the source code. This ensures that diagram updates are reviewed alongside code changes.
- Limit Page Size: If an IOD is too large, consider breaking it into multiple views. A single page should ideally fit within a standard screen view without excessive scrolling.
- Use Consistent Naming: Ensure that interaction frame names match the terminology used in the codebase. If the code uses “OrderService”, the diagram should not say “CheckoutHandler”.
- Review Regularly: Include diagram updates in the Definition of Done for relevant tickets. If a feature changes the workflow, the IOD must change.
Common Pitfalls to Avoid ⚠️
Even experienced architects can fall into traps when modeling interactions. Being aware of these common errors can save significant time.
- Over-Abstraction: If the diagram is too high-level, it loses its value as a design tool. Ensure enough detail is present to guide implementation.
- Ignoring Error Paths: Most diagrams show the “Happy Path.” An effective IOD must also show error handling and fallback mechanisms. What happens if the payment gateway fails?
- Cross-Referencing Loops: Avoid circular references between diagrams. If Diagram A references Diagram B, and Diagram B references Diagram A, it creates confusion about the entry point.
- Too Many Parallel Flows: While concurrency is powerful, too many parallel threads in a single diagram can make it unreadable. Group related parallel tasks.
- Missing Entry/Exit Points: Every frame should clearly show where it starts and ends. Ambiguous boundaries lead to confusion about state management.
Integrating IODs into the Development Lifecycle 🔄
The Interaction Overview Diagram is not just a static artifact for documentation. It plays a dynamic role in the software development lifecycle.
Design Phase
During the design phase, the IOD helps stakeholders visualize the flow of data. It allows for early detection of logical errors, such as deadlocks or unreachable states, before code is written.
Implementation Phase
Developers can use the IOD as a reference while coding. It serves as a contract for how different parts of the system should interact. If the code deviates from the diagram, it signals a potential architectural drift.
Testing Phase
QA teams can use the IOD to generate test cases. Each path in the diagram represents a potential test scenario. Branches at decision nodes indicate the need for positive and negative testing paths.
Maintenance Phase
When onboarding new developers, the IOD provides a quick overview of the system’s behavior. It is more accessible than reading raw code for understanding high-level workflows.
The Impact on Team Communication 🗣️
One of the primary benefits of using Interaction Overview Diagrams is the improvement in communication. Different roles within a team interpret information differently. Developers focus on implementation details, while managers focus on process efficiency.
The IOD acts as a common language. It abstracts the technical details enough for managers to understand the process, while providing enough structure for developers to understand the logic. This alignment reduces the back-and-forth required to clarify requirements.
Facilitating Code Reviews
During code reviews, having a diagram helps reviewers understand the context of the changes. If a developer modifies a function, the reviewer can look at the IOD to see how that function fits into the larger workflow. This context ensures that changes do not break downstream dependencies.
Supporting System Evolution
As systems evolve, the IOD helps track changes in logic. It provides a historical record of how the workflow was intended to function at different points in time. This is invaluable when debugging issues that arose from legacy logic.
Technical Considerations for Tooling 🖥️
While this guide does not endorse specific software, the choice of tooling impacts the usability of IODs. Regardless of the platform used, certain features are necessary.
- Drag-and-Drop Interaction: The tool should allow easy placement of frames and control flows.
- Refinement Capabilities: The ability to drill down into a specific frame to see its detailed sequence diagram is crucial.
- Export Options: Diagrams should be exportable to PDF or image formats for presentations and reports.
- Collaboration Features: Real-time editing allows multiple architects to work on the same diagram without conflicts.
- Validation Rules: The tool should flag invalid connections, such as control flows that do not connect to a valid node.
Selecting a tool that supports these features ensures that the effort put into creating the diagram is not wasted due to usability issues. The goal is to spend time on design, not on fighting the software.
Summary of Architectural Benefits 🏆
Utilizing Interaction Overview Diagrams brings several distinct advantages to the architecture process. These benefits compound over time as the system matures.
- Clarity: Reduces ambiguity in complex workflows.
- Consistency: Ensures all team members follow the same logical paths.
- Efficiency: Saves time during debugging and onboarding.
- Scalability: Helps manage complexity as the system grows.
- Documentation: Provides a living record of system behavior.
The Interaction Overview Diagram is a powerful instrument in the architect’s toolkit. It transforms abstract requirements into concrete visual logic. By mastering the notation and applying it consistently, teams can build systems that are easier to understand, maintain, and extend. The investment in creating these diagrams pays dividends in the form of reduced technical debt and clearer communication channels.
As you move forward with your design projects, consider where the Interaction Overview Diagram fits into your workflow. It may be the missing piece that brings clarity to your most complex systems.