


Modern software architecture often resembles a sprawling city rather than a single building. As systems grow in scope, the interactions between various components become increasingly difficult to visualize and manage. In this landscape, clarity is not just a convenience; it is a necessity. This guide explores how Interaction Overview Diagrams (IODs) serve as a critical tool for architects and developers seeking to impose order on complexity. By utilizing these diagrams, teams can map high-level workflows, orchestrate complex processes, and ensure that every component plays its intended role within the broader system.
Understanding the flow of data and control across a distributed environment requires more than just listing dependencies. It demands a structured approach to visualization. An Interaction Overview Diagram provides that structure. It combines the structural overview of an activity diagram with the specific interaction details found in sequence diagrams. This hybrid approach allows for a comprehensive view of system behavior without getting lost in the minutiae of individual messages.
🧩 Understanding the Interaction Overview Diagram
An Interaction Overview Diagram is a behavioral diagram within the Unified Modeling Language (UML) framework. It is designed to show the control flow between interactions. While a sequence diagram focuses on the detailed exchange of messages between objects in a specific scenario, an IOD operates at a higher level of abstraction. It acts as a map, guiding the reader through the major steps of a process.
The primary purpose of an IOD is to manage complexity. When a system involves multiple threads, asynchronous processes, or distinct microservices, a single sequence diagram becomes unwieldy. It creates a linear path that cannot easily represent branching logic or parallel execution. The IOD solves this by breaking down a complex interaction into smaller, manageable frames. Each frame encapsulates a specific interaction scenario, such as a sequence diagram, and connects them using control flow edges.
Key characteristics include:
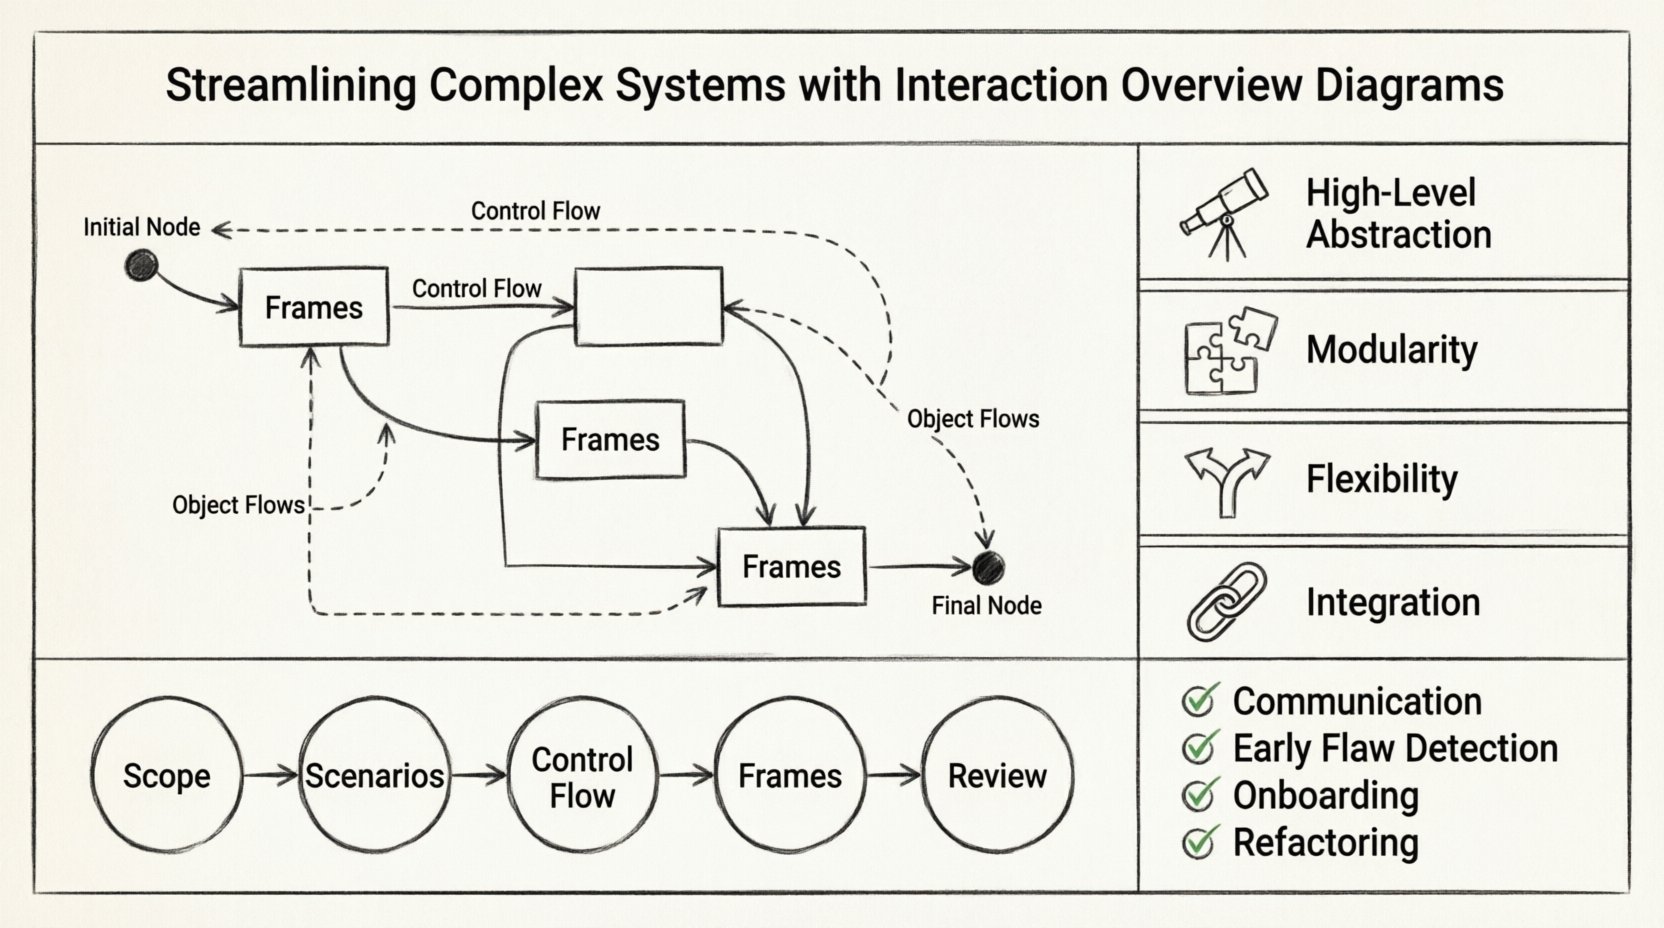
- High-Level Abstraction: Focuses on the flow of control rather than individual message timing.
- Modularity: Allows for the reuse of interaction scenarios within different contexts.
- Flexibility: Supports decision nodes, forks, and joins to represent logic branching.
- Integration: Connects seamlessly with other UML behavioral diagrams.
🔍 Anatomy of an Effective Diagram
To construct a useful Interaction Overview Diagram, one must understand its constituent parts. These elements work together to define the logic and structure of the system interaction.
1. Frames
Frames are the containers within an IOD. They represent specific interaction scenarios, typically sequence diagrams or communication diagrams. A frame allows the designer to zoom in on a particular part of the workflow without cluttering the main overview. Inside a frame, you might find the detailed messaging between a client and a database, while the surrounding IOD shows how that database call fits into the larger request lifecycle.
2. Control Flow Edges
Control flow edges connect the initial node to the frames and between frames. These edges dictate the order of execution. Unlike a standard activity diagram, which might use activities to represent steps, an IOD uses frames to represent entire interaction sets. The edges carry control tokens from one node to another, ensuring the process follows a logical path.
3. Object Flows
While control flow manages the execution order, object flows manage the data passing between interactions. This is crucial for understanding how data transforms as it moves through the system. Object flows are represented by arrows that carry information rather than control signals.
4. Initial and Final Nodes
Every process must have a start and an end. The initial node, usually a solid circle, marks the entry point of the interaction. The final node, often a solid circle within a larger circle, marks the successful termination. In complex systems, there may be multiple final nodes representing different outcomes, such as a successful transaction versus an error state.
📊 Comparison: IOD vs. Other Diagrams
Selecting the right diagram type is as important as drawing the diagram itself. Below is a comparison to clarify when to use an Interaction Overview Diagram versus other common UML diagrams.
| Diagram Type | Primary Focus | Best Used For |
|---|---|---|
| Sequence Diagram | Message timing and order | Detailed design of a single scenario |
| Activity Diagram | Workflow logic and state | Business process modeling and algorithms |
| Interaction Overview Diagram | Orchestrating interactions | Complex systems with multiple scenarios |
| State Machine Diagram | Object lifecycle states | Objects with complex state transitions |
When the system logic is too complex for a single sequence diagram, the IOD bridges the gap. It allows architects to say, “First, this happens (Sequence A), then that happens (Sequence B), unless this condition is met (Decision), in which case Sequence C occurs.” This high-level orchestration is the unique value proposition of the IOD.
🛠️ Creating an Interaction Overview Diagram
Creating an effective diagram requires a disciplined approach. It is not merely about drawing shapes; it is about modeling the reality of the system. Follow these steps to ensure accuracy and utility.
Step 1: Define the Scope
Before drawing, identify the boundary of the interaction. Is this the entire user login flow? Is it a specific payment processing routine? Defining the scope prevents the diagram from becoming too large to comprehend. Keep the focus on the interactions, not the internal implementation details of every single class involved.
Step 2: Identify Key Scenarios
List the distinct paths the system might take. A simple “happy path” is rarely enough. Identify error conditions, retries, and alternative flows. Each significant scenario should ideally be represented by a separate frame in the overview.
Step 3: Draft the Control Flow
Sketch the backbone of the diagram. Place the initial node, the decision points, and the final nodes. Connect them with control flow edges. At this stage, do not worry about the contents of the frames. Just establish the order of operations.
Step 4: Populate the Frames
Now, detail the interactions inside each frame. If a frame represents a sequence, draw the lifelines and messages required to complete that specific step. Ensure that the inputs and outputs of the frame match the control flow entering and leaving it. This consistency is vital for the diagram to be accurate.
Step 5: Review and Refine
Walk through the diagram as if you were a computer executing the logic. Does every path lead to a termination point? Are there dead ends? Is the flow intuitive for a stakeholder? Refine labels and notation to ensure clarity.
⚠️ Common Pitfalls to Avoid
Even experienced practitioners can fall into traps when modeling complex systems. Being aware of these common errors helps maintain the integrity of the documentation.
- Over-Abstraction: If the frames are too vague, the diagram loses its utility. Ensure each frame contains enough detail to be actionable.
- Under-Abstraction: If you include every single message in the overview, you defeat the purpose of the diagram. Keep the overview focused on control flow, not message exchange.
- Ignoring Error Paths: Many diagrams only show the successful path. A robust system handles failures gracefully. Ensure error handling is represented in the control flow.
- Inconsistent Naming: Use consistent terminology for objects and actions. If a frame is labeled “Process Payment,” do not refer to it as “Payment Handler” elsewhere.
- Circular Dependencies: Ensure that the flow does not create infinite loops unless explicitly intended for retry mechanisms.
🔗 Integrating with System Architecture
An Interaction Overview Diagram does not exist in a vacuum. It is part of a larger documentation ecosystem. To maximize its value, it must integrate with other architectural artifacts.
Connection to Sequence Diagrams
The IOD references sequence diagrams. This relationship should be maintained as the system evolves. If a sequence diagram changes, the reference in the IOD must be updated. This ensures that the high-level view remains accurate to the low-level implementation.
Connection to Class Diagrams
While the IOD focuses on behavior, the objects involved have structure. Ensure that the lifelines used in the frames correspond to the classes defined in the structural diagrams. This alignment prevents a disconnect between “what the system does” and “what the system is.”
Connection to Deployment Diagrams
In distributed systems, interactions often span multiple nodes. An IOD can help visualize which components interact across network boundaries. This is particularly useful for understanding latency and communication protocols in microservice architectures.
🔄 Maintenance and Lifecycle Management
Documentation that is not maintained becomes misleading. An outdated diagram can be more dangerous than no diagram at all. Treat the Interaction Overview Diagram as a living document that evolves with the codebase.
- Version Control: Store diagrams alongside the source code. This ensures that changes to the diagram are tracked and reviewed.
- Change Management: When a significant feature is added, review the IOD. Does the new feature fit into the existing flow? Does it require a new branch in the control flow?
- Regular Audits: Schedule periodic reviews of the diagrams. Ask the development team if the current diagrams still reflect the system’s behavior.
🚀 Benefits for Complex Systems
Why invest the effort in creating these diagrams? The return on investment becomes apparent when dealing with intricate systems.
1. Enhanced Communication
Stakeholders often have different perspectives. Developers care about logic, while managers care about process. An IOD provides a neutral ground where both can understand the system’s behavior. It translates technical implementation into a process flow that is easier to digest.
2. Early Detection of Flaws
Modeling the interactions before coding allows teams to spot logical errors. If a flow leads to a state where data is inaccessible, or if a service call is made without authentication, the diagram reveals this before a single line of code is written.
3. Simplified Onboarding
When new developers join a project, they need to understand how the system works. A well-documented IOD serves as a roadmap. It explains the entry points and the general flow of control, reducing the time required to become productive.
4. Facilitates Refactoring
As systems evolve, refactoring is inevitable. Knowing the interaction flows helps identify which components can be changed without breaking the overall process. It highlights dependencies and critical paths that must remain stable.
🎯 Best Practices for Clarity
To ensure the diagram serves its purpose, adhere to these guidelines for clarity and readability.
- Use Consistent Notation: Follow UML standards for symbols. Deviating from standard notation can confuse readers who are familiar with the conventions.
- Limit Complexity: If a frame becomes too crowded, break it down further. A diagram with too many frames is just as bad as one that is too simple.
- Label Clearly: Every node and edge should have a descriptive label. Avoid generic terms like “Process” or “Check.” Use specific terms like “Validate User Credentials” or “Check Inventory.
- Group Related Interactions: Use frames to group related scenarios. This reduces visual noise and highlights the modular nature of the design.
- Color Coding: While standard UML is black and white, using color in digital tools can help distinguish between different types of flows (e.g., control vs. data, or success vs. error paths).
📝 Final Thoughts on System Design
Designing complex systems is a balancing act between detail and abstraction. The Interaction Overview Diagram occupies a vital niche in this balance. It provides the macro view of how different micro-interactions come together to form a cohesive whole. By adopting this tool, teams can navigate the intricacies of modern software architecture with greater confidence.
Effective documentation is not about creating artifacts for the sake of compliance. It is about creating a shared understanding that drives better decisions. When the flow of control is clear, the path to implementation is smoother. The effort invested in crafting a precise Interaction Overview Diagram pays dividends in reduced bugs, faster development cycles, and clearer communication across the team.
As you move forward with your architectural planning, consider where the complexity lies. If your system relies on orchestrating multiple services or handling branching logic, an IOD is likely the right tool for the job. Keep the diagrams simple, keep them accurate, and keep them updated. In doing so, you build a foundation for a system that is not only functional but also maintainable and understandable.