


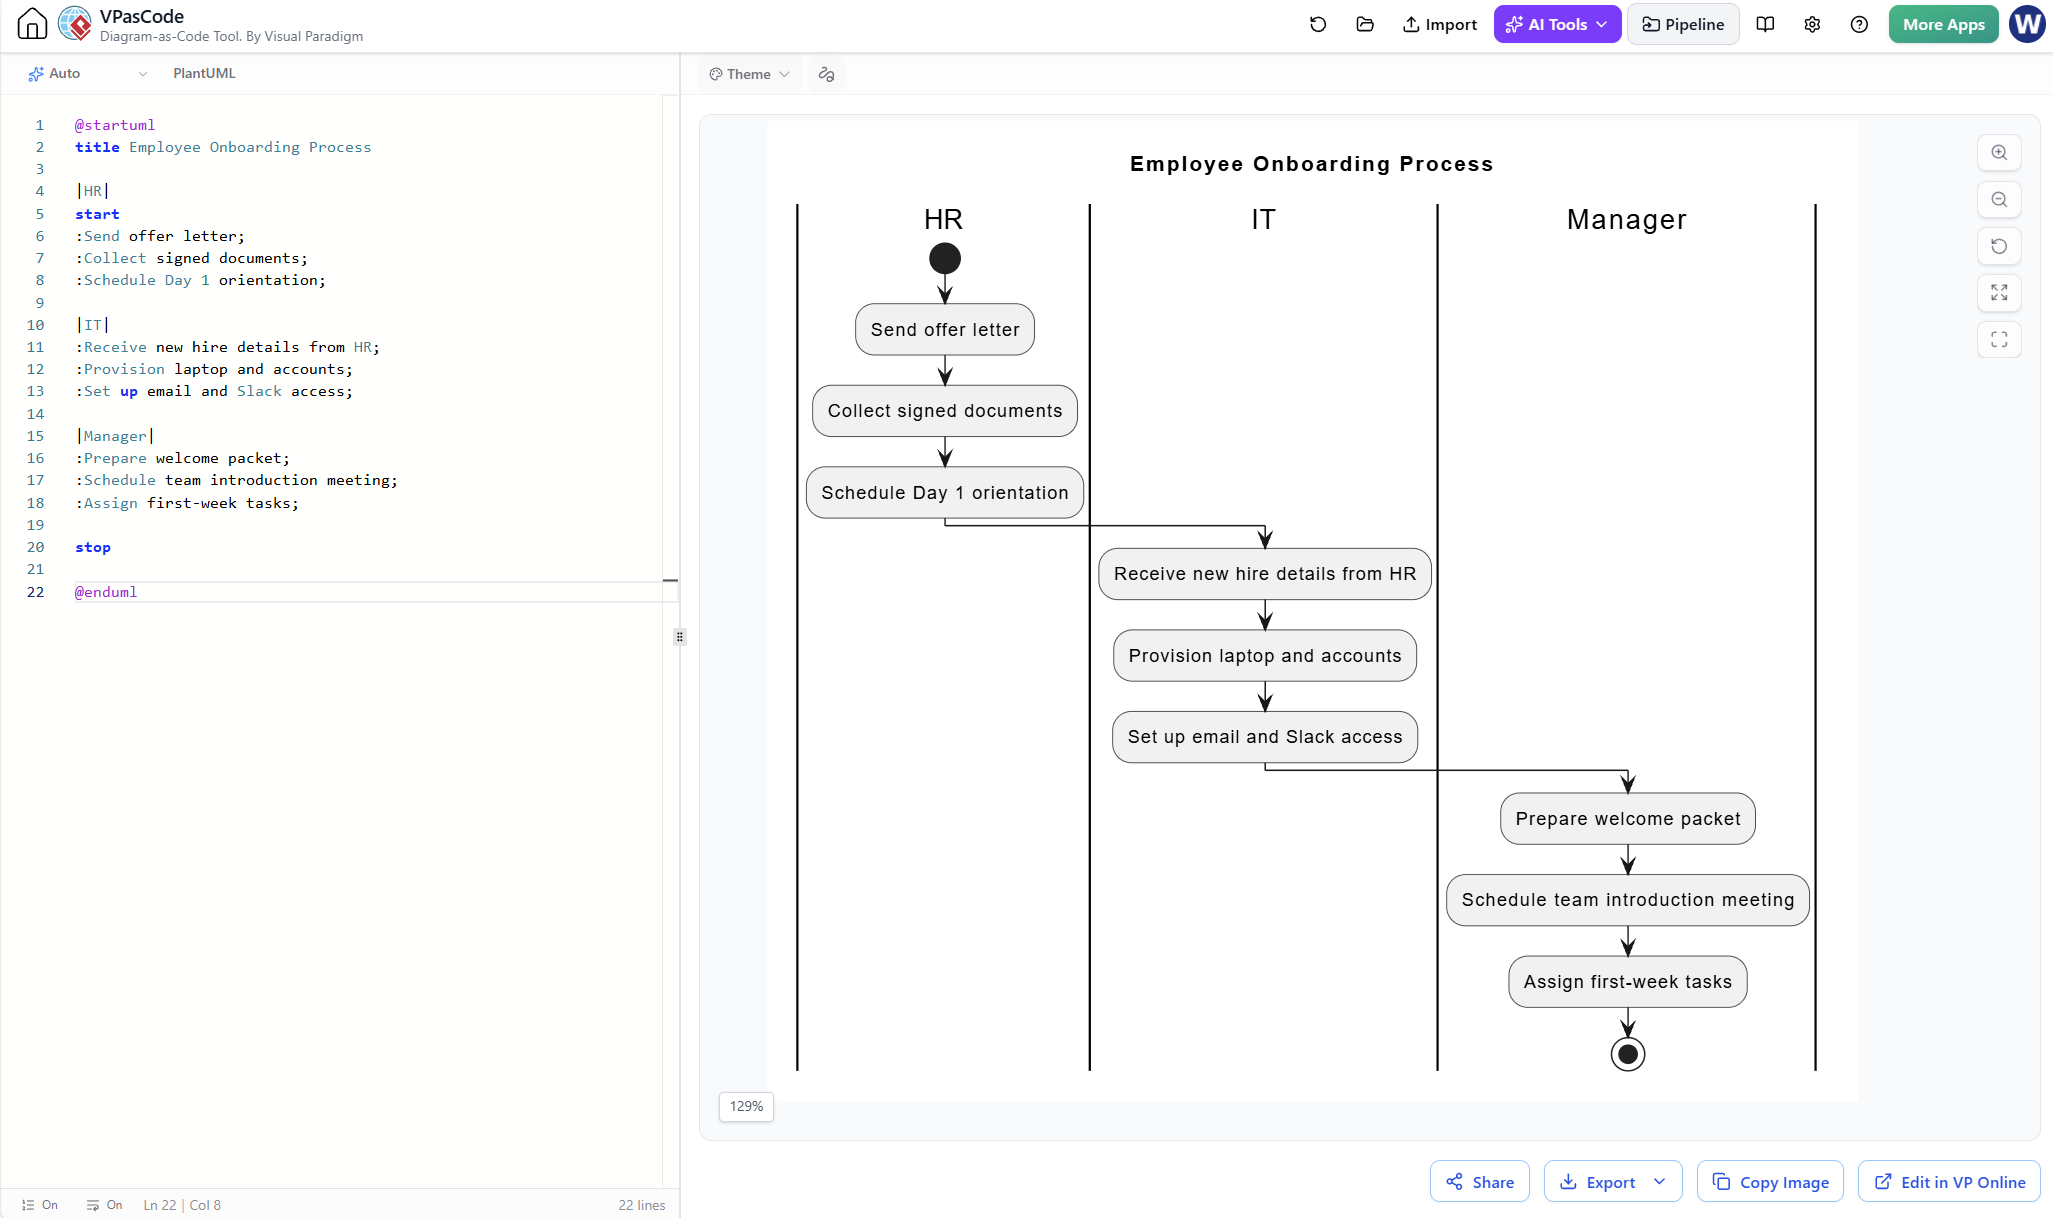
In the realm of business process modeling, clarity is king. When a process involves multiple departments—such as Human Resources, IT, and Management—visualizing the flow of information becomes critical. This tutorial explores the architecture of a Cross-Functional Flowchart, often referred to as a Swimlane Diagram, specifically within the context of an Employee Onboarding Process.
We will dissect how to structure these diagrams using the VPasCode tool (Visual Paradigm’s code-as-text editor), analyzing how to define partitions, handle state transitions, and manage handoffs between organizational units.
Understanding the Architecture: The Swimlane Concept
A swimlane diagram is a variation of a flowchart. While a standard flowchart shows the steps of a process, a swimlane diagram organizes these steps into “lanes” that represent specific roles, departments, or systems. This architectural choice allows stakeholders to immediately see:
- Responsibility: Which actor is responsible for a specific task.
- Handoffs: Where the process moves from one department to another.
- Dependencies: Which tasks must wait for others to complete.
In our Employee Onboarding example, we have three distinct lanes: HR, IT, and Manager. The flow starts in the HR lane and cascades down, requiring handoffs to IT for provisioning, and finally to the Manager for team integration.
Deconstructing the VPasCode Model
Using VPasCode allows us to define complex visual structures using text. This approach is highly efficient for version control and rapid prototyping. Let’s break down the syntax used to generate the diagram shown in the provided context.
1. Defining the Global Context
Every diagram begins with a header. The @startuml command initializes the PlantUML engine, and the title command defines the meta-data for the chart.
@startuml
title Employee Onboarding Process
2. The Magic of Partitions (Swimlanes)
In VPasCode and PlantUML, swimlanes are created using the partition keyword. The syntax is distinct: the lane name must be enclosed in vertical bars |Name|.
|HR|
start :Send offer letter;
:Collect signed documents;
:Schedule Day 1 orientation;

|IT|
:Receive new hire details from HR;
:Provision laptop and accounts;
:Set up email and Slack access;

|Manager|
:Prepare welcome packet;
:Schedule team introduction meeting;
:Assign first-week tasks;
stop
Key Concept: Notice how the code simply lists the tasks under each partition. VPasCode automatically draws the vertical lines (the swimlanes) to separate these sections. The flow logic is sequential within the lane until a decision point or a visual handoff occurs.
3. Managing State Transitions and Handoffs
The diagram relies on implicit flow control. In the HR lane, the process starts at start and moves through three tasks. The visual connector (the arrow) drops from the bottom of the “Schedule Day 1 orientation” box and crosses the vertical boundary into the IT lane.
This crossing of the boundary is the visual representation of a process handoff. The IT team cannot begin “Provision laptop” until the HR team has “Scheduled Day 1 orientation,” establishing a clear dependency chain.
Best Practices for Process Modeling
When modeling an onboarding process, it is vital to maintain a logical flow. The sequence below represents the standard “Happy Path” of employee integration:
- Preparation (HR): The process begins with the legal and administrative setup (Offer Letter).
- Provisioning (IT): Once the hire is confirmed, IT prepares the digital workspace.
- Integration (Manager): The final step is human integration, where the manager assigns tasks and introduces the new hire to the team.
This separation ensures that no department is waiting on another unnecessarily. For instance, IT can prepare the laptop before the manager assigns tasks, but the manager cannot assign meaningful tasks until the employee is officially “onboarded” via HR.
Conclusion
The Employee Onboarding Process diagram serves as a perfect example of how diagram-as-code tools like VPasCode streamline the creation of complex organizational models. By using simple text syntax, you can generate professional, editable, and version-controlled flowcharts that clearly delineate responsibilities between HR, IT, and Management.