


As software systems grow in complexity, the need for precise architectural documentation becomes critical. Developers and architects often struggle to bridge the gap between high-level business logic and low-level execution flow. This is where the Interaction Overview Diagram (IOD) steps in. It serves as a powerful tool for modeling the flow of control among interaction diagrams.
This guide explores the essential role of Interaction Overview Diagrams in modern system design. We will examine their structure, utility, and how they fit into the broader ecosystem of software visualization. By understanding these diagrams, teams can improve communication, reduce ambiguity, and streamline the development lifecycle.
🔍 Understanding the Interaction Overview Diagram
An Interaction Overview Diagram is a specialized type of UML diagram that combines elements of Activity Diagrams and Interaction Diagrams. Its primary purpose is to show the control flow between different interaction diagrams. While a Sequence Diagram details the specific messages exchanged between objects over time, an IOD provides a macro view of how those interactions fit into a larger process.
Think of an Interaction Overview Diagram as a map of a journey, while Sequence Diagrams are the detailed street-level views of specific segments of that journey. This distinction is vital for maintaining clarity in large-scale projects.
🛠️ Core Components of an IOD
To create effective diagrams, one must understand the building blocks. The syntax is derived from standard UML activity modeling, adapted for interaction contexts.
- Control Nodes: These define the flow of control. They include initial nodes (start points), final nodes (end points), decision nodes (diamonds with multiple outgoing paths), and merge nodes (combining paths).
- Interaction Nodes: These represent specific interaction diagrams. They act as sub-graphs within the larger overview. Each node can encapsulate a Sequence Diagram, Communication Diagram, or Timing Diagram.
- Object Nodes: These represent the flow of data or objects between interaction nodes. They help visualize what information is passed from one interaction context to another.
- Swimlanes: While less common in IODs than Activity Diagrams, swimlanes can organize interaction nodes by actor or system component to show responsibility distribution.
⚖️ Comparison with Other Modeling Diagrams
Selecting the right visualization tool is key. Using an IOD where a Sequence Diagram would suffice creates unnecessary clutter. Conversely, using only Sequence Diagrams for a high-level workflow can lead to fragmentation. Below is a breakdown of how IODs compare to other common modeling artifacts.
| Diagram Type | Primary Focus | Best Used For | Limitations |
|---|---|---|---|
| Interaction Overview Diagram | Control flow between interactions | Complex workflows involving multiple scenarios | Can become complex if not simplified |
| Sequence Diagram | Message exchange over time | Detailed logic of a single transaction | Hard to use for high-level branching logic |
| Activity Diagram | Business logic and state transitions | General process flow without object focus | Lacks specific object interaction details |
| State Machine Diagram | Object states and triggers | Objects with distinct lifecycle states | Not designed for message flow visualization |
When designing a system, it is often necessary to use a combination of these. However, the IOD is unique because it allows you to group complex sequences into single nodes, reducing cognitive load.
🚀 Benefits of Using Interaction Overview Diagrams
Adopting IODs offers tangible advantages for technical teams. These benefits extend beyond mere documentation to actual engineering efficiency.
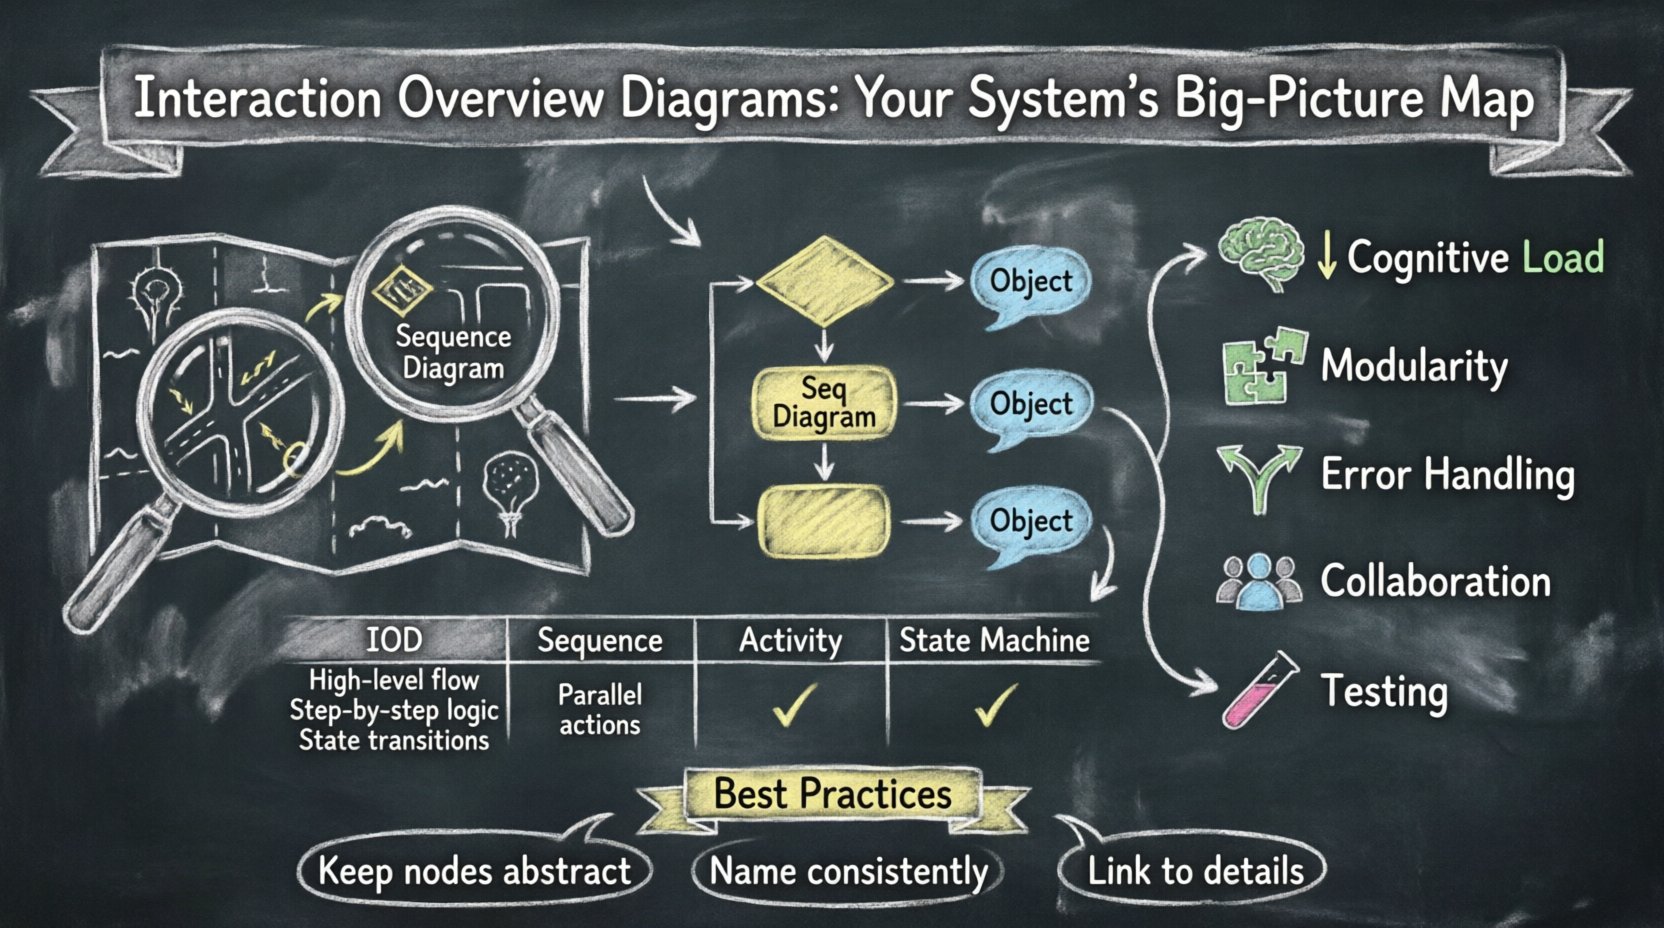
- Reduces Cognitive Load: By encapsulating complex sequences into single nodes, architects can present the big picture without overwhelming stakeholders with every message exchange.
- Improves Modularity: Breaking a system down into interaction nodes encourages modular design. Teams can work on specific interaction nodes independently, knowing the interface is defined by the overview.
- Clarifies Error Handling: Decision nodes in an IOD allow for explicit mapping of error paths and alternative flows. This makes it easier to identify where exceptions might occur in the broader system.
- Enhances Collaboration: A clear overview serves as a common language between developers, product managers, and QA engineers. It aligns everyone on the expected flow of operations.
- Facilitates Testing Strategy: Testers can derive test cases directly from the control flow. Each path in the overview represents a potential test scenario.
🧩 When to Use an Interaction Overview Diagram
Not every system needs an IOD. Over-modeling can lead to maintenance nightmares. The following scenarios indicate when an IOD is most appropriate.
- Complex Multi-Step Processes: If a user action triggers a chain of events across different services, an IOD maps these steps clearly.
- Orchestration Logic: When an API Gateway or Orchestrator directs traffic to various microservices, an IOD visualizes the routing logic.
- Parallel Processing: If a system must handle multiple interactions simultaneously before converging, IODs show parallel forks and joins effectively.
- Conditional Branching: When the flow changes drastically based on input data, decision nodes in an IOD highlight these branching points better than a linear sequence.
📝 Best Practices for Creating Effective IODs
Creating a diagram is one thing; creating a useful one is another. Adhering to specific guidelines ensures the diagram remains a valuable asset throughout the project lifecycle.
1. Keep Interaction Nodes Abstract
Do not include every detail inside an Interaction Node. An Interaction Node should represent a complete interaction diagram. If you find yourself adding more than 10 messages inside a node, consider splitting it into a new sub-diagram. The overview should remain high-level.
2. Consistent Naming Conventions
Ensure all nodes follow a clear naming standard. Use action-oriented verbs for decision nodes and noun phrases for interaction nodes. Consistency helps readers scan the diagram quickly.
3. Manage Control Flow Complexity
Avoid spaghetti loops. If the control flow becomes too tangled, the diagram loses its value. Use structured constructs like loops and branches explicitly. Ensure every path leads to a final node.
4. Link to Detailed Models
Always maintain the link between the IOD and the detailed Sequence Diagrams it references. This ensures that changes in the details are reflected in the overview context.
5. Use Color Coding Strategically
While standard UML is black and white, digital modeling tools often allow color. Use colors to distinguish between different system components or to highlight critical paths (e.g., error handling vs. happy path).
🔄 Common Pitfalls to Avoid
Even experienced architects can stumble when modeling complex flows. Being aware of common mistakes helps maintain diagram integrity.
- Duplicate Logic: Do not repeat the same interaction node multiple times unless the context is different. Instead, use decision nodes to route to a single shared node.
- Ignoring Data Flow: While control flow is primary, the data passed between nodes matters. Ensure Object Nodes are used to show what data is transferred.
- Over-Engineered Start Points: Sometimes a single start node is enough. Adding unnecessary initial nodes for different entry points can confuse the flow.
- Lack of Error Paths: Many diagrams only show the “happy path.” A robust IOD must account for failures, timeouts, and rejected requests.
🔮 The Future of System Visualization
As technology evolves, so do the tools for modeling. The static nature of traditional diagrams is shifting towards dynamic and interactive models. Here is where the Interaction Overview Diagram fits into future trends.
AI-Assisted Diagram Generation
Artificial Intelligence is beginning to analyze codebases and generate UML diagrams automatically. In the future, IODs could be derived directly from workflow definitions or API specifications. This reduces the manual overhead of maintaining diagrams.
Real-Time Synchronization
Current tools often suffer from diagram rot—where the model no longer matches the code. Future visualization tools will likely integrate with CI/CD pipelines to update diagrams in real-time as code changes. This ensures the IOD remains a single source of truth.
Interactive Exploration
Static images limit understanding. Interactive IODs will allow users to click on nodes and drill down into the specific sequence logic without leaving the overview context. This drill-down capability enhances the utility of the diagram during troubleshooting.
Integration with Microservices
Microservices architecture relies heavily on interaction. IODs are naturally suited for this. Future trends point towards IODs becoming the primary documentation standard for service orchestration, replacing verbose API documentation in many contexts.
🏁 Moving Forward with Better Visualization
System complexity is not going away. As applications become more distributed and asynchronous, the need for clear, high-level flow modeling increases. The Interaction Overview Diagram provides a structured way to manage this complexity without losing sight of the details.
By leveraging IODs, teams can achieve a balance between abstraction and specificity. It allows architects to communicate the “what” and “how” of system behavior effectively. Whether you are designing a monolithic application or a cloud-native microservice ecosystem, the principles of interaction overview remain relevant.
Focus on clarity, maintain consistency, and prioritize the user of the diagram over the creator. When done correctly, an Interaction Overview Diagram becomes more than just documentation—it becomes a blueprint for successful engineering.
📌 Key Takeaways
- Hybrid Nature: IODs blend Activity and Interaction diagram concepts to show control flow between interactions.
- Modularity: They allow complex sequences to be grouped, simplifying the visualization of large workflows.
- Decision Making: They are essential for mapping conditional logic and error handling across multiple services.
- Maintenance: Keep them linked to detailed models to prevent documentation drift.
- Future Ready: Automation and real-time updates will likely increase their adoption in modern DevOps environments.
Investing time in mastering these visualization techniques pays dividends in system reliability and team alignment. Start incorporating Interaction Overview Diagrams into your design process today to see the improvements in clarity and efficiency.