


Understanding the flow of logic within a complex system is a fundamental challenge for any software architect. While sequence diagrams excel at showing interactions between specific objects over time, they often struggle to represent high-level control flow across multiple operations. This is where the Interaction Overview Diagram becomes essential. It provides a macroscopic view of the system’s behavior, focusing on the sequence of actions rather than individual object exchanges. 🏗️
This guide serves as a comprehensive resource for architects looking to integrate this UML artifact into their design process. We will explore its structure, utility, and implementation without relying on proprietary tools or marketing fluff. The goal is to build a clear mental model of how control moves through a system.
What Is an Interaction Overview Diagram? 🤔
An Interaction Overview Diagram is a type of activity diagram that organizes interaction fragments. It acts as a bridge between high-level activity diagrams and detailed sequence diagrams. Instead of drawing every single message exchange, you define interaction fragments that represent complex behaviors. These fragments are then connected to show the overall flow of control.
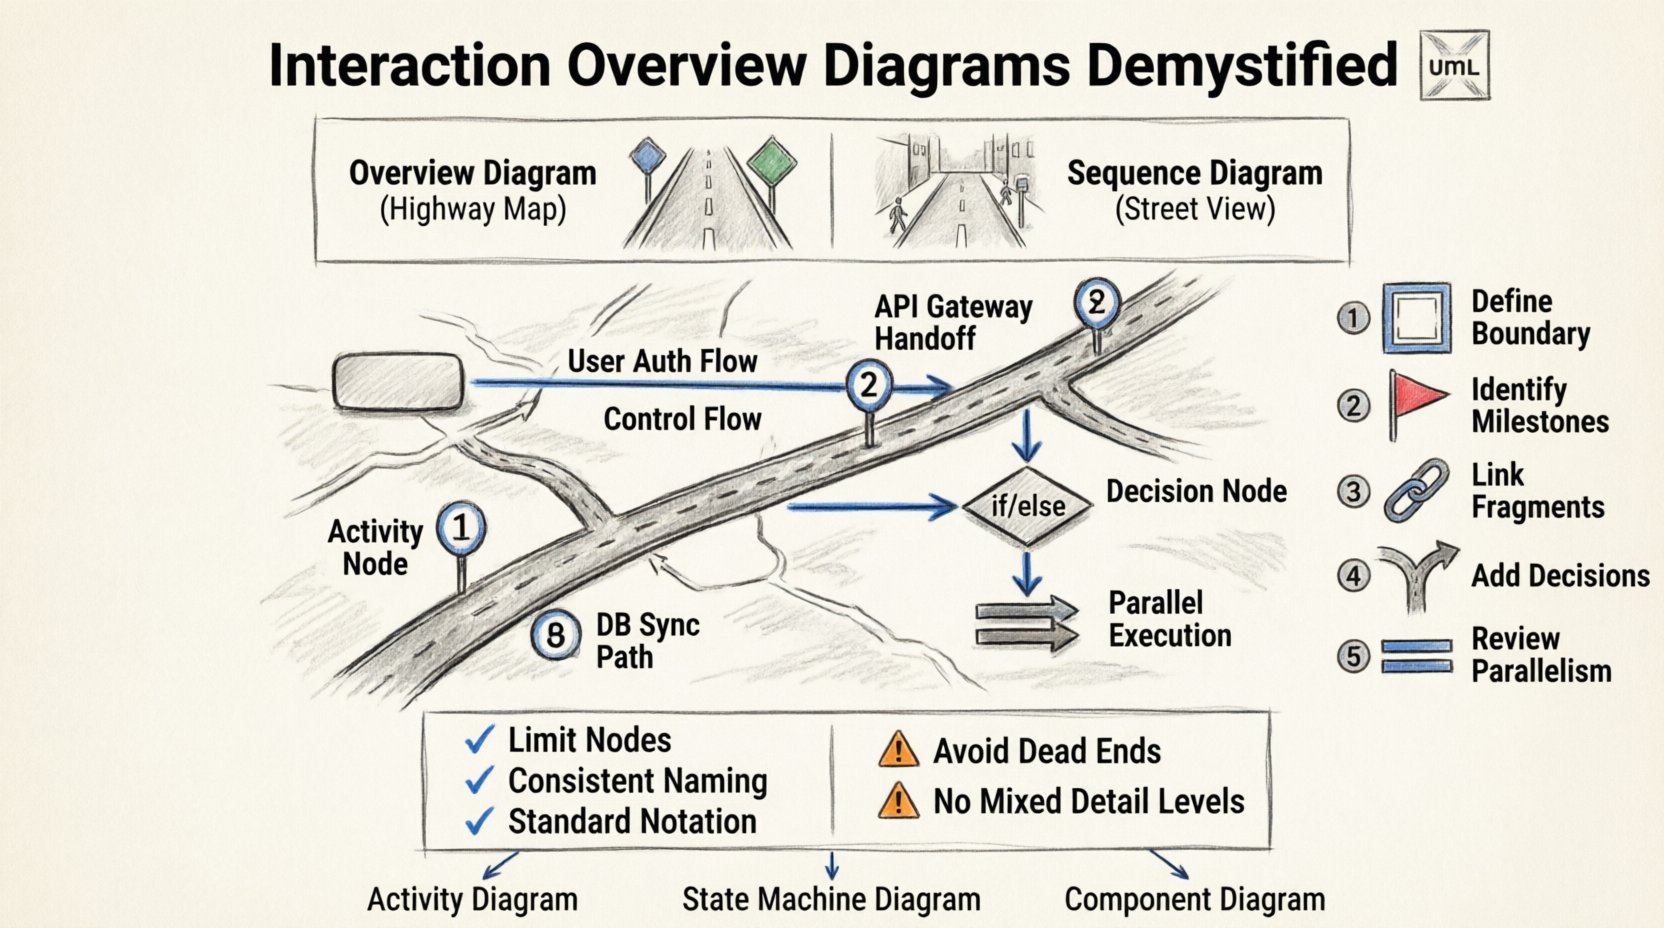
Think of it as a map. If a sequence diagram is a street-level view showing every turn and intersection, the Interaction Overview Diagram is the highway map showing the route from City A to City B without detailing every side street.
Key Characteristics
- Control Flow Focus: It emphasizes the order of operations and decision points.
- Abstraction: It hides the internal details of complex interactions.
- Modularity: It allows you to break down a large system into manageable interaction chunks.
- Integration: It links directly to sequence diagrams or other interaction diagrams.
Core Components and Notation 🛠️
To use this diagram effectively, you must understand its building blocks. These are standard UML elements adapted for interaction contexts.
1. Activity Nodes
These define the steps in the process. In an interaction context, they represent a call to an interaction fragment. They look like rounded rectangles.
- Call Behavior Action: Represents the invocation of an operation.
- Interaction Use: A specific notation linking to a sequence diagram instance.
2. Control Flows
These are the arrows that connect the activity nodes. They dictate the path the system takes. Unlike sequence diagrams where time flows vertically, here the flow is dictated by the arrows.
- Standard Flow: Indicates the next step in the process.
- Decision Node: A diamond shape where the path branches based on a condition.
- Fork/Join: Allows for parallel execution of interaction fragments.
3. Object Flows
While less common in pure interaction overviews, object flows can show the passing of data between interaction fragments if the data context needs to be explicit. However, the primary focus remains on control.
Interaction Overview vs. Sequence Diagrams 🆚
One of the most common questions arises during design reviews. When should you use one over the other? Understanding the distinction prevents diagram clutter and improves communication.
| Feature | Interaction Overview Diagram | Sequence Diagram |
|---|---|---|
| Scope | Macro level, system-wide flow | Micro level, specific object interactions |
| Focus | Control flow and decision logic | Message exchange and timing |
| Complexity | Hides detail, focuses on structure | Reveals detail, focuses on behavior |
| Readability | High for high-level stakeholders | High for developers and implementers |
| Best Used For | Workflow orchestration | API contract and logic verification |
Step-by-Step Construction Guide 📝
Creating a robust diagram requires a methodical approach. Follow this workflow to ensure consistency and clarity.
Step 1: Define the Boundary
Start by identifying the system boundary. What is the trigger? What is the expected outcome? Define the start and end points of the interaction flow. Do not include unrelated system behaviors.
Step 2: Identify Major Milestones
Break the process down into major phases. These become your primary activity nodes. For example, in an order processing system, phases might include “Validate Order”, “Process Payment”, and “Ship Goods”.
Step 3: Link Interaction Fragments
For each phase, determine if a detailed sequence diagram is needed. If the logic within a phase is complex, create a sequence diagram and reference it using an Interaction Use node in your overview diagram.
Step 4: Add Decision Points
Identify where the system makes choices. Use decision nodes to represent these branching paths. Label the edges clearly with conditions (e.g., Payment Approved?, Yes, No).
Step 5: Review for Parallelism
Check if any steps can happen simultaneously. Use fork and join nodes to represent parallel threads of execution. This is crucial for performance analysis.
Best Practices for Clarity and Maintenance 🌟
A diagram that is too complex defeats its purpose. Use these guidelines to keep your models clean and useful.
1. Limit the Number of Nodes
A single diagram should ideally fit on one screen. If it requires scrolling, split it into sub-diagrams. Group related flows together. Avoid a “spaghetti diagram” where lines crisscross randomly.
2. Consistent Naming Conventions
Use clear, descriptive names for all nodes and edges. Avoid abbreviations that might confuse team members. If a node represents a specific business process, name it after that process (e.g., Approve Credit Application rather than Process 1).
3. Minimize Cross-References
While linking to sequence diagrams is good practice, do not over-rely on it. If an interaction fragment requires a deep dive into multiple sequence diagrams, the overview is becoming too granular. Consider breaking the overview down.
4. Use Standard Notation
Stick to standard UML symbols. Deviations can cause confusion during reviews. Ensure decision diamonds have exactly one incoming flow and two or more outgoing flows.
5. Document Assumptions
Include a legend or notes section for non-standard flows. If a loop represents a retry mechanism, document the maximum retry count in the notes. This prevents ambiguity.
Common Pitfalls to Avoid ⚠️
Even experienced architects make mistakes when designing these diagrams. Being aware of common errors can save significant time during refactoring.
- Ignoring Dead Ends: Ensure every path leads to an end node. A flow that stops at a node without a defined exit indicates missing logic.
- Overusing Loops: While loops are valid, excessive looping in an overview diagram makes it hard to trace execution. Define iteration counts or conditions clearly.
- Mixing Levels of Detail: Do not mix high-level business processes with low-level database queries in the same diagram. Keep the granularity consistent.
- Neglecting Error Paths: Focus heavily on the happy path. Explicitly map out error handling and exception flows. This is where system resilience is defined.
- Static State Representation: Remember that this is a dynamic diagram. Do not use it to show static structure like class relationships. Use Class Diagrams for that.
Integration with Other Design Artifacts 🔗
An Interaction Overview Diagram does not exist in a vacuum. It must work in harmony with other parts of your documentation suite.
1. Activity Diagrams
Interaction Overview Diagrams are essentially specialized activity diagrams. If your system involves extensive data processing outside of object interactions, you may need a standard Activity Diagram to handle those specific data transformations.
2. State Machine Diagrams
For systems with complex lifecycle states (e.g., Order Status: Pending, Shipped, Returned), a State Machine Diagram is often better. Use the Interaction Overview for the actions taken when a state changes.
3. Component Diagrams
Link the interaction fragments to the components responsible for them. This helps in tracing which architectural layer handles specific logic. It aids in identifying coupling issues.
Refining the Model: Iteration and Review 🔄
Design is iterative. Your first draft will likely require changes. Here is how to approach the review process.
1. Walkthroughs
Conduct walkthroughs with stakeholders. Ask them to trace the flow from start to finish. If they get stuck at a decision node, the logic needs clarification.
2. Consistency Checks
Verify that the interaction fragments referenced in the overview match the actual sequence diagrams. If the sequence diagram changes, the overview must be updated to reflect that change.
3. Tool Agnostic Updates
Ensure your diagrams are portable. Since you are not using specific software tools, keep the diagrams in a format that can be shared easily, such as standard image files or vector graphics, ensuring they remain readable across different platforms.
Conclusion on Application 🎯
Mastering the Interaction Overview Diagram is about clarity. It allows you to step back from the code and see the system’s logic. By focusing on control flow and abstracting away message details, you provide a view that is valuable for both technical and non-technical stakeholders.
Remember to keep it simple. Use the table comparisons to decide when to switch to a sequence diagram. Follow the construction steps to maintain consistency. Avoid the common pitfalls to ensure reliability. And always integrate it with your broader architectural documentation.
With practice, these diagrams become a natural part of your design toolkit. They reduce ambiguity, streamline communication, and help prevent architectural drift. Treat them as living documents that evolve with your system, not as static artifacts to be filed away.
Start small. Diagram one critical flow. Refine it. Then expand to the next. Over time, you will build a comprehensive map of your system’s behavior that stands the test of time.