


Managing complex systems requires more than just coding or component selection. It demands a clear vision of how disparate parts function together over time. For technical leaders, the ability to visualize control flow at a high level is critical. This is where the Interaction Overview Diagram (IOD) serves its purpose. It bridges the gap between static structure and dynamic behavior.
When leading engineering teams, stakeholders often struggle to see the big picture. They see isolated features or individual blocks. An IOD pulls these threads together. It shows the sequence of operations across different components. This visibility reduces ambiguity. It clarifies responsibility. It highlights dependencies before they become blockers.
This guide explores how to leverage Interaction Overview Diagrams effectively. We will look at the structure, the strategic value, and the practical application. No specific tools are required to understand these concepts. The focus remains on the methodology and the leadership outcomes.
🧠 What Is an Interaction Overview Diagram?
An Interaction Overview Diagram is a type of behavioral diagram used in system modeling. It is designed to show the control flow of an interaction. Unlike a standard sequence diagram, which focuses on one specific timeline, an IOD can manage multiple interactions. It acts as a map for complex workflows.
Think of it as a flowchart for system behavior. It dictates which interaction occurs next based on conditions. It allows for branching, merging, and looping. This flexibility makes it ideal for describing complex business logic or system processes.
Key characteristics include:
- High-Level View: It abstracts details found in lower-level diagrams.
- Control Flow: It emphasizes the order of execution and decision points.
- Modularity: It references other diagrams (like Sequence Diagrams) as nodes.
- Decision Logic: It handles conditions, loops, and concurrent paths.
For a technical leader, this means you are looking at the logic of the system, not just the data. This distinction is vital for architecture planning.
🏗️ Anatomy of an Effective IOD
To use this tool effectively, one must understand its building blocks. An IOD is composed of specific nodes and edges. Each element serves a distinct purpose in the control flow.
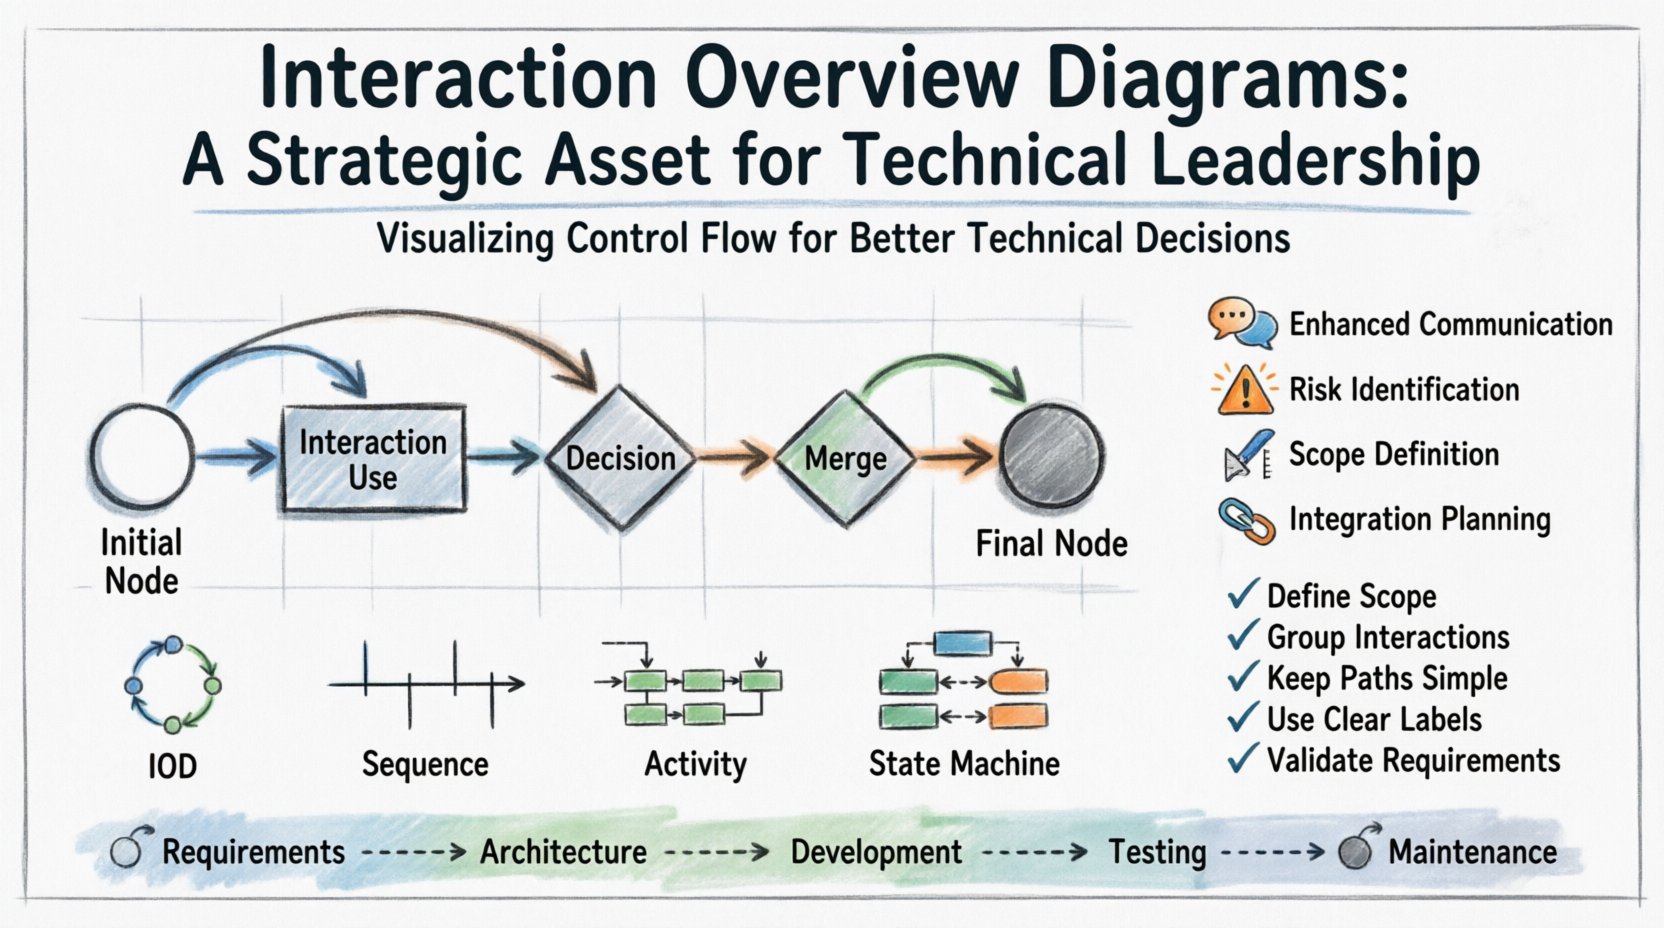
1. Initial Node
This marks the starting point of the interaction. It is where the process begins. All paths should trace back to a single entry point to maintain clarity.
2. Interaction Use Node
This is the core component. It represents a reference to another diagram, typically a Sequence Diagram. It encapsulates a specific behavior or sub-process. Instead of drawing every message line, you group them here.
3. Decision Node
At this point, the flow branches. One or more paths may be taken based on a condition. It looks like a diamond shape. Clear labels on the outgoing edges are mandatory to avoid confusion.
4. Merge Node
Conversely, this is where paths come back together. It ensures that subsequent steps occur regardless of which branch was taken previously.
5. Final Node
This signifies the end of the interaction. It indicates successful completion or termination.
Understanding these nodes allows you to deconstruct complex systems into manageable chunks. It prevents the “spaghetti diagram” effect where lines cross and become unreadable.
🚀 Why Technical Leaders Prioritize IODs
Technical leadership involves more than just writing code. It involves strategy, communication, and risk management. Interaction Overview Diagrams support these areas in tangible ways.
1. Enhanced Communication
Stakeholders often speak different languages. Developers talk about code paths. Product managers talk about user stories. An IOD provides a neutral visual language. It translates technical logic into a process flow that non-technical stakeholders can follow.
2. Risk Identification
Complex systems have hidden risks. An IOD exposes decision points where failure might occur. If a branch has no clear exit, it represents a potential deadlock. If a merge node is missing, data integrity might be compromised. Catching these early saves significant resources later.
3. Scope Definition
Projects often suffer from scope creep. An IOD defines the boundaries of a process. It shows where a system action starts and ends. This clarity helps in estimating effort and resources accurately.
4. Integration Planning
Modern systems are rarely monolithic. They integrate with external services. An IOD helps map these handoffs. It shows where one system hands control to another. This is crucial for API design and interface contracts.
📊 IOD vs. Other Diagramming Methods
Selecting the right diagram for the right job is a common challenge. Below is a comparison to help clarify when to use an Interaction Overview Diagram versus other common models.
| Diagram Type | Primary Focus | Best Used For | Limitations |
|---|---|---|---|
| Interaction Overview Diagram | Control flow across interactions | High-level logic, branching, loops | Less detail on individual message exchanges |
| Sequence Diagram | Message exchange over time | Specific scenarios, timing details | Hard to show complex branching logic |
| Activity Diagram | Workflow steps and actions | Business processes, algorithmic steps | Does not explicitly show object interactions |
| State Machine Diagram | Object states and transitions | Lifecycle management, state-dependent behavior | Not ideal for message-based flows |
As the table shows, an IOD is unique in its ability to reference other diagrams while maintaining a high-level control flow. It is the best choice when you need to orchestrate multiple scenarios.
🛠️ Creating Effective Interaction Overview Diagrams
Creating a useful diagram requires discipline. It is easy to create a diagram that looks pretty but conveys little information. Follow these best practices to ensure value.
1. Define the Scope Clearly
Before drawing, define the start and end points. What triggers the process? What is the expected outcome? Without this, the diagram becomes a collection of unrelated nodes.
2. Group Related Interactions
Do not scatter nodes randomly. Group related interactions together. Use the Interaction Use Node to encapsulate complex sequences. This keeps the overview clean.
3. Keep Paths Simple
Avoid excessive nesting. If a decision node has too many outgoing paths, consider splitting the logic into sub-diagrams. Clarity is more important than completeness in a single view.
4. Use Consistent Naming
Labels should be descriptive. Use action verbs. Instead of “Check”, use “Verify User Credentials”. Consistency helps readers scan the diagram quickly.
5. Validate Against Requirements
Every node should trace back to a requirement. If a path exists that does not serve a requirement, remove it. This prevents feature bloat.
⚠️ Common Pitfalls to Avoid
Even experienced architects can make mistakes when modeling control flow. Being aware of these common pitfalls helps maintain diagram quality.
- Over-Modeling: Trying to show every single message in the overview defeats the purpose. Keep it high-level.
- Missing Error Paths: Focusing only on the happy path leaves the system vulnerable. Explicitly model error handling branches.
- Unclear Decision Logic: Labels like “True/False” are often too vague. Use “Success/Fail” or specific conditions like “Inventory Available”.
- Disconnected Nodes: Ensure every node is reachable from the start and leads to an end. Orphaned nodes indicate logic errors.
- Ignoring Concurrency: If parts of the system run in parallel, the IOD must reflect synchronization points.
🔗 Integrating IODs into the Workflow
An IOD is not a static artifact. It should evolve with the project. Here is how to integrate it into the standard development lifecycle.
Phase 1: Requirements Analysis
During this phase, the IOD helps validate requirements. Does the proposed logic actually solve the problem? It identifies gaps in the requirement set.
Phase 2: Architecture Design
Architects use the IOD to define system boundaries. It informs the design of APIs and interfaces. It ensures that the architecture supports the required workflows.
Phase 3: Development
Developers reference the IOD to understand the context of their code. It serves as a guide for implementation logic. Unit tests can be derived directly from the decision nodes.
Phase 4: Testing and Verification
Testers use the IOD to design test cases. They verify that every path is covered. It ensures that error handling works as intended.
Phase 5: Maintenance
When changes occur, the IOD is updated first. It serves as documentation for future engineers. This reduces the knowledge transfer time.
📈 Measuring the Impact of IODs
How do you know if using Interaction Overview Diagrams is working? You need metrics. Hard data proves the strategic value to stakeholders.
- Requirement Defect Rate: Measure the number of defects found in requirements that relate to logic flow. A drop indicates better clarity.
- Time to Onboard: Track how long it takes new team members to understand the system logic. Diagrams should reduce this time.
- Rework Frequency: Monitor how often the system logic needs to be changed after deployment. Better upfront modeling reduces post-deployment fixes.
- Stakeholder Satisfaction: Survey product owners on their understanding of the system. Improved communication should correlate with higher satisfaction.
🔮 Future Considerations for System Modeling
As systems become more distributed and microservices-based, the need for clear interaction modeling grows. The principles behind the Interaction Overview Diagram remain relevant, even as the underlying technology changes.
Cloud-native architectures introduce new complexities. Service meshes and event-driven systems require a way to trace control flow across network boundaries. The IOD adapts well to this. It can represent asynchronous calls and event triggers without getting bogged down in network latency details.
Artificial intelligence and machine learning are also entering the mix. When a system includes automated decision-making, the IOD helps visualize the human-in-the-loop aspects. It shows where the AI acts and where human intervention is required.
🤝 Aligning Teams Through Visual Logic
One of the most underrated benefits of the IOD is team alignment. In large organizations, silos are common. The backend team might not know what the frontend team expects. The IOD acts as a contract of behavior.
It forces a conversation about the flow. It asks the question: “What happens if this step fails?”. It brings together the people responsible for each step to agree on the outcome. This alignment reduces friction during development.
Leadership should encourage the use of these diagrams in sprint planning. They provide a visual aid for story mapping. They help estimate complexity better than text descriptions alone.
🏁 Final Thoughts on Strategic Modeling
Interaction Overview Diagrams are more than just technical drawings. They are tools for thinking. They force the architect to confront the logic of the system before writing a single line of code. For technical leaders, this capability is a competitive advantage.
It reduces risk. It improves communication. It clarifies scope. By adopting this method, teams can build systems that are robust, maintainable, and aligned with business goals. The investment in modeling pays dividends in execution.
Start small. Pick one complex process. Draw the IOD. Review it with the team. Iterate. Over time, this practice becomes a natural part of the development culture. The result is a more predictable and efficient delivery pipeline.
Complexity is inevitable. Clarity is a choice. Choose the tools that bring clarity to your leadership toolkit.