


System architecture often involves complex flows that are difficult to visualize through static text or isolated diagrams. When a single sequence diagram cannot capture the breadth of a workflow, or an activity diagram lacks the necessary detail on object interactions, the Interaction Overview Diagram (IOD) provides the necessary bridge. This guide explores the mechanics, notation, and practical application of IODs to enhance system documentation and communication.
Understanding how different parts of a system communicate across multiple sequences is vital for robust design. By mastering the structure of an IOD, architects can map out control flows and object interactions without getting lost in the minutiae of every single message exchange. This document serves as a technical reference for creating effective diagrams that align with UML standards.
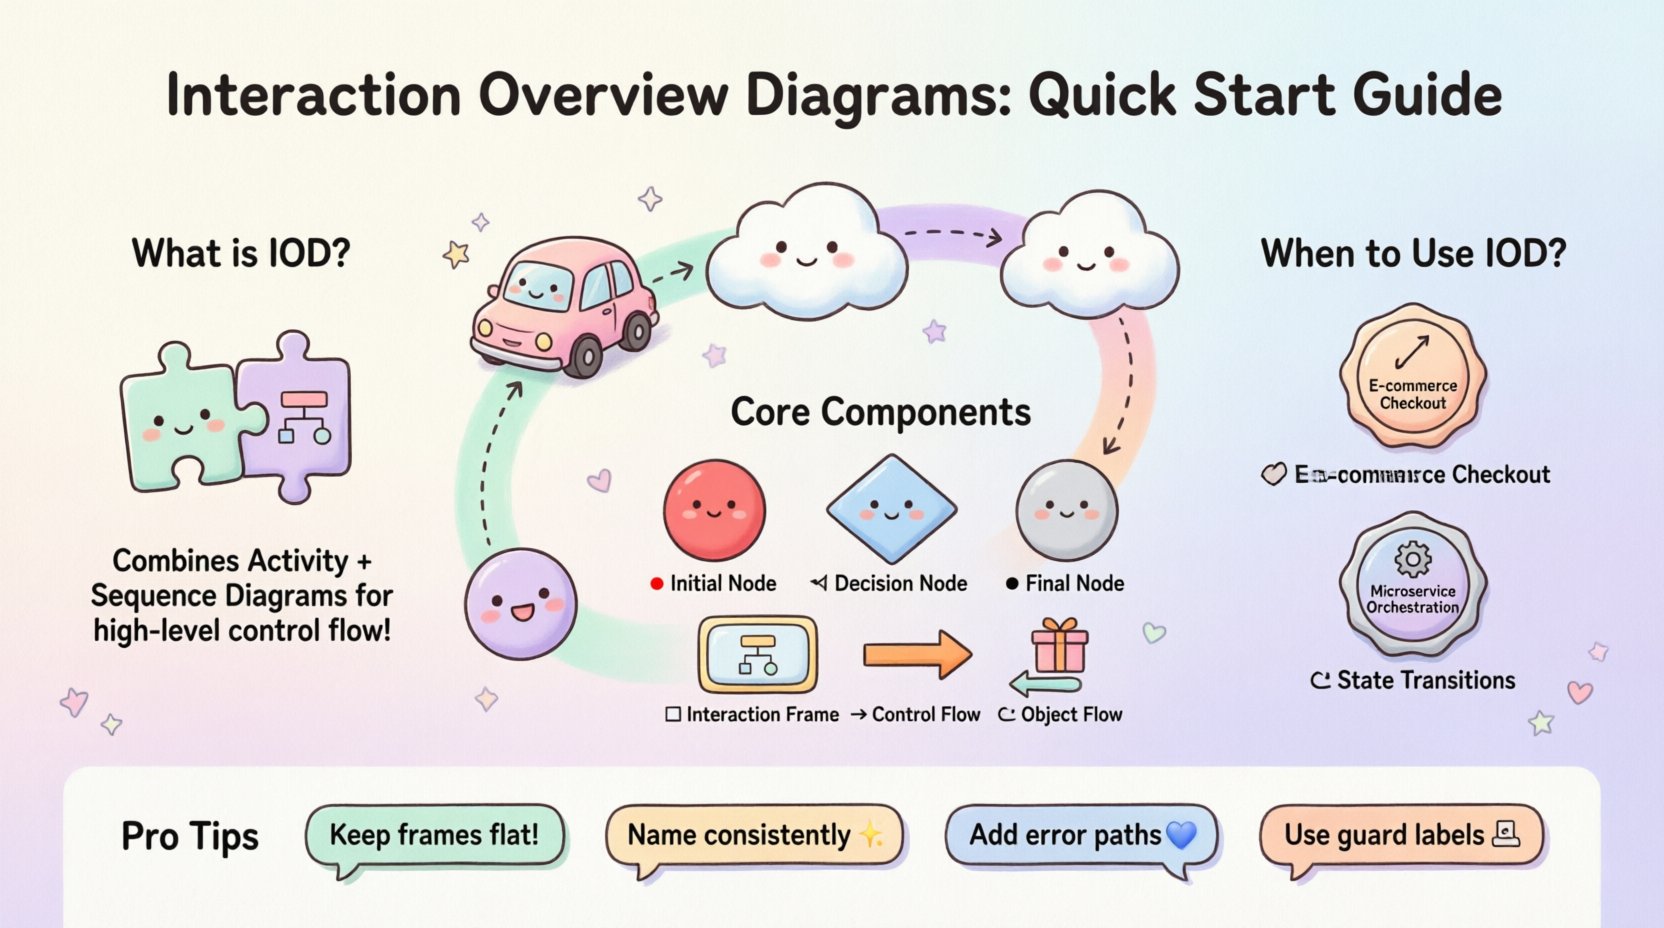
📐 What is an Interaction Overview Diagram?
An Interaction Overview Diagram is a type of UML (Unified Modeling Language) diagram that combines elements of Activity Diagrams and Interaction Diagrams. It provides a high-level view of control flow within a system, linking together specific interaction scenarios. Unlike a Sequence Diagram, which focuses on the time-ordered exchange of messages between objects, an IOD focuses on the logical flow of control between these interactions.
Think of the IOD as a roadmap for a journey. The Activity Diagram represents the major stops, while the Sequence Diagrams represent the detailed driving instructions for each leg of the trip. The IOD connects these legs, showing how one sequence transitions into another based on conditions, loops, or parallel execution.
🔍 Key Characteristics
- High-Level Control Flow: Focuses on the decision points and transitions between major interaction scenarios.
- Integration of Sequence Diagrams: Uses frames to encapsulate detailed sequence diagrams within the overview.
- UML 2.0 Standard: Aligns with the official UML specification for behavior modeling.
- Scalability: Allows designers to manage complexity by breaking down large processes into manageable chunks.
🛠️ Core Components and Notation
To construct a valid IOD, one must understand the standard symbols used to represent control flow and interaction frames. These elements are consistent with UML activity diagram notation, adapted to accommodate interaction content.
| Symbol | Name | Function |
|---|---|---|
| 🔴 | Initial Node | Represents the starting point of the control flow. |
| ⚫ | Final Node | Represents the successful termination of the flow. |
| ⚪ | Activity Node | Represents a specific task or an entire interaction frame. |
| ⬡ | Decision Node | A diamond shape that splits the flow based on conditions (e.g., True/False). |
| ⬡ | Merge Node | Combines multiple incoming flows into a single outgoing flow. |
| 🔳 | Interaction Frame | A rectangular box containing a Sequence Diagram, labeled with “seq”. |
| ➡️ | Control Flow | Directs the order of execution between nodes. |
| 🔄 | Object Flow | Shows the flow of data or objects between activities. |
🌊 Control Flow vs. Object Flow
Distinguishing between control flow and object flow is essential for accurate modeling. While both are represented by arrows, their semantics differ significantly.
- Control Flow: Indicates the sequence of execution. It dictates when an activity happens. If an activity node represents a sequence diagram, control flow enters the diagram, executes the internal logic, and exits when the interaction is complete.
- Object Flow: Indicates the movement of data. It shows what is being passed. For example, an order object might flow from a “Place Order” activity to a “Process Payment” activity. This helps visualize data dependencies rather than just execution timing.
In many complex systems, control flow is the primary driver of the diagram. Object flow is optional and used when data lineage is critical for understanding the system state changes.
📝 Step-by-Step Creation Process
Creating an IOD requires a structured approach to ensure the diagram remains readable and useful. Follow these steps to build a robust overview.
1. Define the Scope and Entry Point
Identify the trigger for the interaction. Is it a user login? A scheduled batch job? Mark the initial node clearly. Ensure there is only one entry point to avoid ambiguity about where the process begins.
2. Identify Major Interaction Scenarios
Break down the main process into distinct scenarios. For example, a user authentication process might have scenarios for “Successful Login,” “Failed Login,” and “Password Reset.” Each of these scenarios will become a node or an interaction frame in the IOD.
3. Select the Level of Detail
Decide how deep to go. Do not embed a full Sequence Diagram for every minor step. Only embed frames for interactions that are complex enough to warrant their own diagram. Simple actions can be represented as text labels within activity nodes.
4. Map the Control Flow
Draw arrows connecting the activity nodes. Use decision nodes to represent conditional logic. For example, if a validation check fails, the flow should merge into an error handling path. If it passes, it proceeds to the next step.
5. Add Interaction Frames
Replace complex activity nodes with interaction frames. Inside each frame, create the corresponding Sequence Diagram. Ensure the inputs and outputs of the frame match the incoming and outgoing control flows of the IOD.
6. Review for Parallelism
Check if any steps can occur simultaneously. If two independent processes run in parallel, use fork and join nodes to represent the start and end of the parallel section. This clarifies concurrency requirements.
🆚 IOD vs. Sequence Diagrams vs. Activity Diagrams
Confusion often arises between these three diagram types. Understanding when to use each ensures the right tool is applied to the problem.
| Diagram Type | Primary Focus | Best Used For |
|---|---|---|
| Sequence Diagram | Message Exchange | Deep dive into how specific objects talk to each other over time. |
| Activity Diagram | Workflow Logic | High-level business processes, algorithms, or state changes without object detail. |
| Interaction Overview | Hybrid Control | Connecting multiple sequence scenarios into a logical flow; managing complexity. |
If you need to explain a specific algorithm to a developer, an Activity Diagram might suffice. If you need to show how a database transaction is structured, a Sequence Diagram is better. If you need to show how a user flow branches into different transaction types, the IOD is the superior choice.
🛡️ Best Practices for Maintainability
A diagram that is difficult to maintain becomes obsolete quickly. Adhere to these guidelines to keep your IODs relevant.
- Limit Frame Depth: Avoid nesting interaction frames inside other interaction frames. This creates a “spaghetti” effect that is hard to read. Keep the hierarchy flat.
- Consistent Naming: Name interaction frames consistently with the activity nodes they replace. This allows for easy cross-referencing.
- Modularize: If a sequence diagram is reused across multiple IODs, keep the sequence diagram as a separate artifact and reference it in the IOD frame.
- Version Control: Treat diagrams as code. Ensure changes to the IOD are tracked and documented alongside the source code.
- Use Guards: Clearly label the conditions on decision nodes (e.g., [Valid Token], [Invalid Token]).
⚠️ Common Pitfalls to Avoid
Even experienced architects make mistakes when modeling complex flows. Watch out for these common issues.
- Overloading Frames: Putting too much logic inside a single interaction frame. If a frame becomes a page of text, split it into smaller frames.
- Ignoring Error Paths: Designing only the happy path. A robust IOD must account for exceptions, timeouts, and failures.
- Mixing Flows: Combining object flow and control flow without clear distinction. Use different line styles or colors if supported by your tooling, or stick to one type per diagram to reduce cognitive load.
- Disconnected Nodes: Leaving nodes without incoming or outgoing arrows. Every node must be reachable from the start and must lead to an end (or a loop).
🔄 Integrating IOD into Design Reviews
The IOD is a powerful communication tool during architectural design reviews. It allows stakeholders to see the big picture without getting bogged down in syntax.
🗣️ Facilitating Discussion
During a review meeting, use the IOD to walk through the lifecycle of a request. Ask questions like:
- Does this decision node cover all edge cases?
- Is the transition between these two sequences logical?
- Are there any parallel processes that could cause race conditions?
This shifts the conversation from implementation details to architectural integrity.
📊 Linking to Documentation
Reference the IOD in your system design documents. Include links to the detailed sequence diagrams contained within the frames. This creates a navigation structure for your documentation, allowing readers to drill down from overview to detail.
🧩 Handling Complexity and Scalability
As systems grow, diagrams can become unwieldy. Here is how to manage that growth.
Sub-Flows and Decomposition
If a section of the IOD becomes too complex, consider creating a sub-diagram. This is similar to a package in code. You can define a sub-process and link to it from the main IOD. This keeps the main diagram clean while preserving detail.
Grouping
Use grouping boxes to visually cluster related interactions. For example, group all “Authentication” related frames together and all “Data Processing” frames together. This visual separation aids in scanning the diagram for specific concerns.
State Invariance
Ensure that the state of the system is consistent between frames. If one frame ends with a user logged in, the next frame should start with that assumption unless a logout is explicitly shown. Document these state assumptions in the notes section of the diagram.
📈 Real-World Application Scenarios
Where do IODs shine in actual engineering environments?
1. E-Commerce Checkout Flows
A checkout process involves cart validation, payment processing, inventory check, and shipping calculation. These are distinct sequences. An IOD maps the order of operations, handling failures like declined payments or out-of-stock items.
2. Microservice Orchestration
In microservices, a single request might trigger multiple service calls. An IOD can show the orchestration logic, including retries and circuit breakers, connecting the individual service interaction diagrams.
3. State Machine Transitions
For systems with complex state changes (e.g., Order Status: Pending -> Paid -> Shipped -> Delivered), an IOD can illustrate the interaction required to transition between states, especially when external triggers are involved.
🔗 Conclusion on Diagram Utility
Interaction Overview Diagrams offer a structured way to manage the complexity of system interactions. By separating the control logic from the message details, they provide clarity without sacrificing necessary information. When used correctly, they serve as a blueprint for developers and a communication tool for stakeholders.
The goal is not to create the most complex diagram, but the most understandable one. Start small, iterate on the control flow, and only add detail where the ambiguity threatens the design. With practice, these diagrams become an integral part of the development lifecycle, reducing defects and improving team alignment.