


Imagine describing a complex business issue in plain English and having a professional, structured Fishbone Diagram pop up in seconds. That’s exactly what the AI Fishbone Diagram Generation feature in Visual Paradigm Desktop delivers. This powerful tool transforms your natural language input into a clear, visual root cause analysis, making it easier than ever to diagnose problems and drive improvement. Visual Paradigm is the go-to AI-powered diagramming software for professionals who need to visualize complex systems and processes quickly and effectively.
Quick summary:
-
AI Fishbone Diagram Generation in Visual Paradigm instantly creates professional diagrams from text descriptions.
-
It uses natural language understanding to detect categories like People, Process, Equipment, and Management.
-
Results are fully editable, follow standard Ishikawa notation, and are perfect for quality improvement and problem-solving.
-
Users can generate diagrams for issues like high employee turnover, late deliveries, or product defects in seconds.
-
The tool is ideal for Six Sigma practitioners, quality managers, project leaders, and educators.
How Does AI Fishbone Diagram Generation Work?
Visual Paradigm’s AI diagram generation feature is a game-changer for anyone who needs to conduct root cause analysis. Instead of spending hours sketching out a Fishbone Diagram by hand or struggling with traditional diagramming tools, you simply describe the problem and its potential causes in plain language. The AI does the rest. Visual Paradigm Desktop then analyzes your text, identifies the main effect, and automatically structures the diagram with the classic fish shape—complete with a head, spine, and categorized bones.
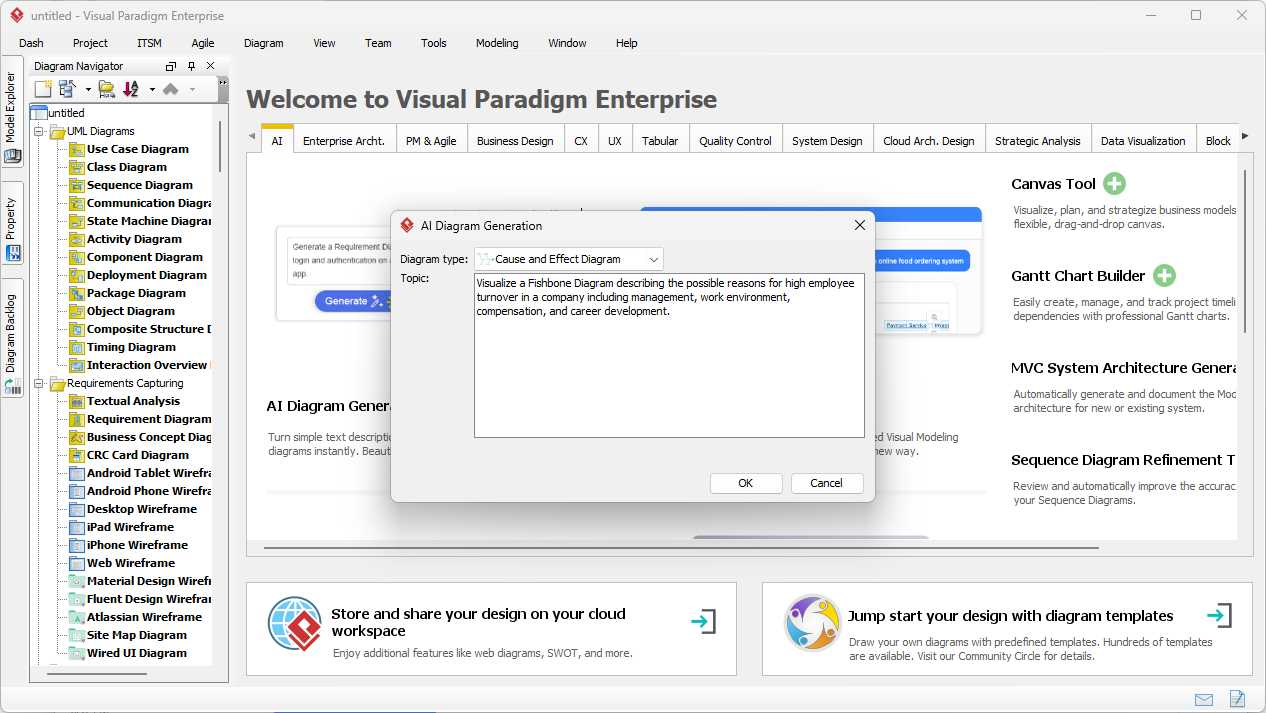
Take a look at Image 1. It shows the AI Diagram Generation dialog in Visual Paradigm. The user has selected “Cause and Effect Diagram” as the diagram type and entered a description: “Visualize a Fishbone Diagram describing the possible reasons for high employee turnover in a company including management, work environment, compensation, and career development.” This simple prompt is all the AI needs to start building a professional analysis tool. The system intelligently understands the context and prepares to generate a structured, hierarchical diagram.
From Text to Visual: The Generated Fishbone Diagram
Now, let’s see the result. Image 2 displays the AI-generated Fishbone Diagram based on the user’s input. The diagram is beautifully structured, with “High employee turnover” as the main effect at the head of the fish. The spine runs horizontally, and the major categories—Compensation, Management, Work Environment, and Career Development—branch out like bones. Each category is further broken down into specific contributing factors, such as “Below-market salary” under Compensation or “Poor communication” under Management.
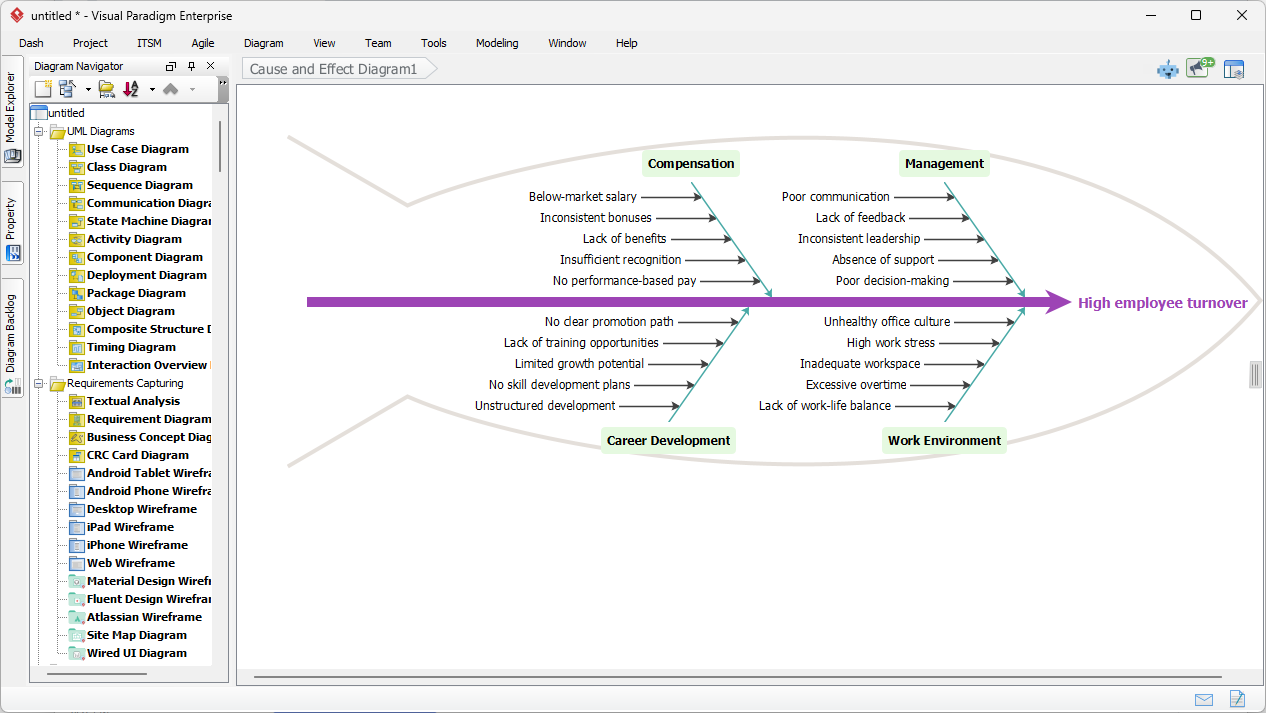
This is where the power of Visual Paradigm shines. The AI doesn’t just create a diagram; it creates a comprehensive visual representation that is immediately ready for discussion. The diagram is not only accurate but also follows the standard conventions of a Fishbone Diagram, ensuring that everyone on the team can understand and use it effectively. The result is a clear, visual map of potential root causes that can be used in team meetings, quality improvement projects, or training sessions.
Who Can Benefit from This AI-Powered Tool?
AI Fishbone Diagram Generation is a must-have for anyone involved in process improvement, quality management, or problem-solving. It’s particularly valuable for:
-
Quality Assurance Professionals: Use it to quickly analyze defects and implement corrective actions.
-
Six Sigma Practitioners: Perfect for conducting root cause analysis in DMAIC projects.
-
Operations Managers: Ideal for troubleshooting issues in manufacturing, logistics, or service delivery.
-
Project Managers: Use it to diagnose delays or performance issues in projects.
-
Business Analysts and Consultants: A powerful tool for conducting root cause investigations.
-
Students and Educators: Learn and teach quality management concepts in a practical, engaging way.
Even if you’re new to Fishbone Diagrams, this tool makes it easy to get started. The AI handles the complex structuring, allowing you to focus on the content and the discussion. It’s a true time-saver that can dramatically improve the quality and speed of your analysis.
Key Benefits of Using AI for Fishbone Diagrams
Why choose AI-powered Fishbone Diagram Generation over traditional methods? Here are the top benefits:
-
Save Time: Eliminate the hours spent organizing brainstorming results into a structured diagram.
-
Improve Accuracy: Ensure consistent use of standard categories (like 6M or 8P) or create custom ones based on your context.
-
Enhance Collaboration: Create a visual tool that everyone can understand and contribute to during team workshops.
-
Boost Quality: Encourage comprehensive analysis by covering all major cause categories.
-
Enable Iteration: Easily refine and update your diagram as new causes are discovered.
With Visual Paradigm, you’re not just creating a diagram—you’re creating a powerful analysis tool that can drive real change in your organization.
Getting Started with AI Fishbone Diagram Generation
Ready to try it? It’s incredibly simple:
-
Open Visual Paradigm Desktop.
-
Go to Tools → AI Diagram Generation.
-
Select Cause and Effect Diagram as the diagram type.
-
Enter your problem description and suspected causes.
-
Click OK and let the AI do the work.
-
Review, refine, and use your diagram in your next meeting or report.
With just a few clicks, you can turn a simple text description into a professional Fishbone Diagram. It’s the fastest way to visualize and solve complex problems.
Try AI Fishbone Diagram Generation Today
Don’t let complex problems hold you back. With Visual Paradigm Desktop, you can generate professional Fishbone Diagrams in seconds—no design skills required. Whether you’re a seasoned quality professional or just starting out, this AI-powered tool will transform the way you approach root cause analysis.
Ready to see the power of AI in action? Download Visual Paradigm Desktop today and start creating your first AI-generated Fishbone Diagram. The future of problem-solving is here—and it’s faster, smarter, and more intuitive than ever.
Related Links
The integration of artificial intelligence into fishbone (Ishikawa) diagrams allows organizations to automate the identification of root causes for complex business and operational problems. These articles demonstrate how AI-powered generators transform natural language text into structured visual models, often integrating other techniques like the 5 Whys to enhance quality management. By utilizing automated tools and specialized templates, teams can conduct faster and more accurate cause-and-effect analysis to improve overall project outcomes.
-
Announcement: AI Fishbone Diagram Generator Launch: This official release introduces an AI-powered generator designed to facilitate faster and more accurate root cause analysis.
-
AI Fishbone Diagram Generator Tool: This dedicated platform automatically creates Ishikawa diagrams to help teams solve complex problems through intelligent automation.
-
AI-Powered Fishbone Diagram Generator – Uncover Root Causes in Seconds: This article explains how the automated generator speeds up decision-making processes by quickly identifying critical issues within a system.
-
Create Fishbone Diagrams from Text Using Visual Paradigm Smart Board: This guide provides instructions on using a collaborative smart board to generate diagrams directly from natural language text input.
-
Fishbone Analysis: Ishikawa Diagram Concepts and AI-Powered Tools: This case study explores core concepts of Ishikawa diagrams and the specific role AI tools play in modern quality management and problem-solving.
-
Fishbone Diagram and 5 Whys Integration: This resource details how to combine fishbone diagrams with the 5 Whys technique to deepen root cause analysis in project management.
-
Unraveling Complex Issues: The Power of Cause and Effect Analysis: This article illustrates how structured cause-and-effect analysis helps resolve business and operational bottlenecks effectively.
-
How to Create a Fishbone Diagram: A Step-by-Step Guide: This comprehensive tutorial provides a structured approach for identifying problems in various processes and technical systems.
-
Fishbone (Ishikawa) Diagram Template – Ready-to-Use: This resource offers access to customizable templates that allow teams to begin analyzing cause-and-effect relationships instantly.
-
Fishbone Diagram Template for Product Defects Analysis: This specialized template is designed for manufacturing and quality assurance teams to systematically analyze product defects and operational failures.