


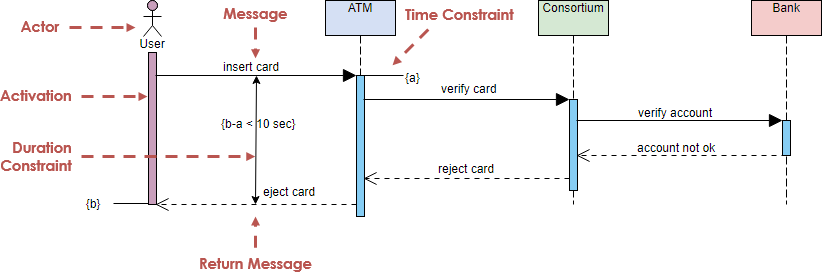
Sequence diagrams are a fundamental component of the Unified Modeling Language (UML) suite, designed to visualize how objects interact over time. Unlike static structure diagrams that show how a system is built, sequence diagrams tell the story of how the system behaves during a specific scenario. In this tutorial, we will explore the anatomy of a sequence diagram using a classic example: an Automated Teller Machine (ATM) transaction. We will break down the interactions between the User, the ATM, the Consortium, and the Bank.
The Anatomy of a Sequence Diagram
A sequence diagram is a dynamic view of the system. It arranges objects involved in a collaboration in a chronological order. To understand the diagram effectively, we must first identify its core components: lifelines, messages, and activation bars.
1. Lifelines and Participants
The diagram is anchored by lifelines, which represent the existence of an object or actor over time. In our ATM example, we have four distinct participants:
- Actor (User): Represented by a stick figure, the human initiating the interaction.
- ATM: The local interface where the user performs actions.
- Consortium: The intermediary system that validates the card.
- Bank: The backend system responsible for verifying account balances.
These participants are arranged horizontally across the top of the diagram, establishing the order of interaction.
2. Messages and Communication
Interactions between objects are depicted as messages. These are arrows pointing from the source lifeline to the destination lifeline. There are two primary types of messages:
- Real Messages (Solid Arrows): These represent a method call or a request. In the diagram, the User sends an
insert cardmessage to the ATM. The ATM then sends averify cardmessage to the Consortium. - Return Messages (Dashed Arrows): These represent the response or the result of a message. When the Consortium determines the card is rejected, it sends a
eject cardmessage back to the User.
3. Activation Bars
When an object receives a message and begins processing it, a vertical rectangle appears on its lifeline. This is called an activation bar (or focus of control). It indicates that the object is active and executing operations. For instance, when the verify account message is sent to the Bank, a blue bar appears on the Bank’s lifeline, showing that it is processing the request.
Advanced Modeling Concepts
Professional sequence diagrams often include constraints and timing information to provide a complete picture of system requirements. Let’s examine the advanced features visible in our ATM scenario.
Time Constraints
Software systems often have strict timing requirements. In the diagram, you can see a dashed red arrow labeled Time Constraint pointing to the interaction between the User and the ATM. This highlights a specific requirement that the system must adhere to within a defined timeframe.
Duration Constraints
Similarly, the diagram uses a Duration Constraint to specify the maximum time allowed for a specific operation. The notation {b-a < 10 sec} defines a logical condition where the time difference between event ‘b’ and event ‘a’ must be less than 10 seconds. This is crucial for real-time systems where user experience depends on speed.
Labels for Clarity
Visual Paradigm allows you to add labels to clarify the flow. In this diagram, labels such as Actor, Message, and Return Message are used to guide the reader. The label (a) marks the specific point in time the ATM sends the verification request, while (b) marks the moment the card is ejected.
Step-by-Step Analysis of the ATM Scenario
Let’s walk through the flow of the diagram chronologically to understand the system logic:
- Initiation: The User (Actor) interacts with the system by sending the
insert cardmessage to the ATM. - Card Verification: The ATM activates and forwards the request to the Consortium via the
verify cardmessage. - Account Verification: The Consortium validates the card and subsequently sends a
verify accountmessage to the Bank to check the account status. - Response: The Bank checks the account and sends back a
account not okresponse to the Consortium. - Rejection: The Consortium processes this failure and sends a
reject cardmessage back to the ATM. - Conclusion: Finally, the ATM sends the
eject cardmessage to the User, completing the interaction loop.
Implementing Sequence Diagrams with Visual Paradigm
Visual Paradigm is a powerful tool that simplifies the creation of complex UML diagrams. It allows users to define lifelines, drag-and-drop messages, and add detailed annotations without needing to write code manually. By using the “UML FREE Tool” capabilities within Visual Paradigm, you can rapidly prototype scenarios and validate system logic.
When modeling in Visual Paradigm, you can:
- Define Lifelines: Create objects and actors with a simple right-click menu.
- Draw Messages: Connect lifelines with solid or dashed arrows to represent synchronous and asynchronous calls.
- Add Constraints: Use the “Constraint” tool to add text boxes with time limits or logical conditions (like
{b-a < 10 sec}). - Manage Activation: The tool automatically draws activation bars when you create messages, keeping the diagram clean and readable.
By mastering these elements, you can create clear, professional sequence diagrams that serve as excellent documentation for developers and stakeholders alike.