


In the world of software engineering and system architecture, understanding when things happen is often just as critical as understanding what happens. While Sequence Diagrams give us a glimpse into the interaction between objects, they often flatten time, making it difficult to visualize concurrent processes or strict temporal constraints. This is where the Timing Diagram becomes an indispensable tool.
Based on the visual interface provided by Visual Paradigm, let’s explore the “Inspection” system model. This tutorial will walk you through the anatomy of a Timing Diagram, explaining how to model the lifecycle of a Safety Inspector and the parallel processing of an Inspector’s tasks.
What is a Timing Diagram?
A Timing Diagram is a specialized type of UML behavioral diagram. It focuses on the changes of state or condition of specific objects over a specific period. Unlike other diagrams that focus on the sequence of messages, Timing Diagrams provide a linear view of time, allowing you to see exactly when an object is in a specific state and how long it stays there.
This is particularly vital for:
- Real-time Systems: Where milliseconds matter.
- Distributed Systems: Where latency and synchronization are key.
- Embedded Systems: Where hardware constraints dictate software behavior.
Deconstructing the “Inspection” Model
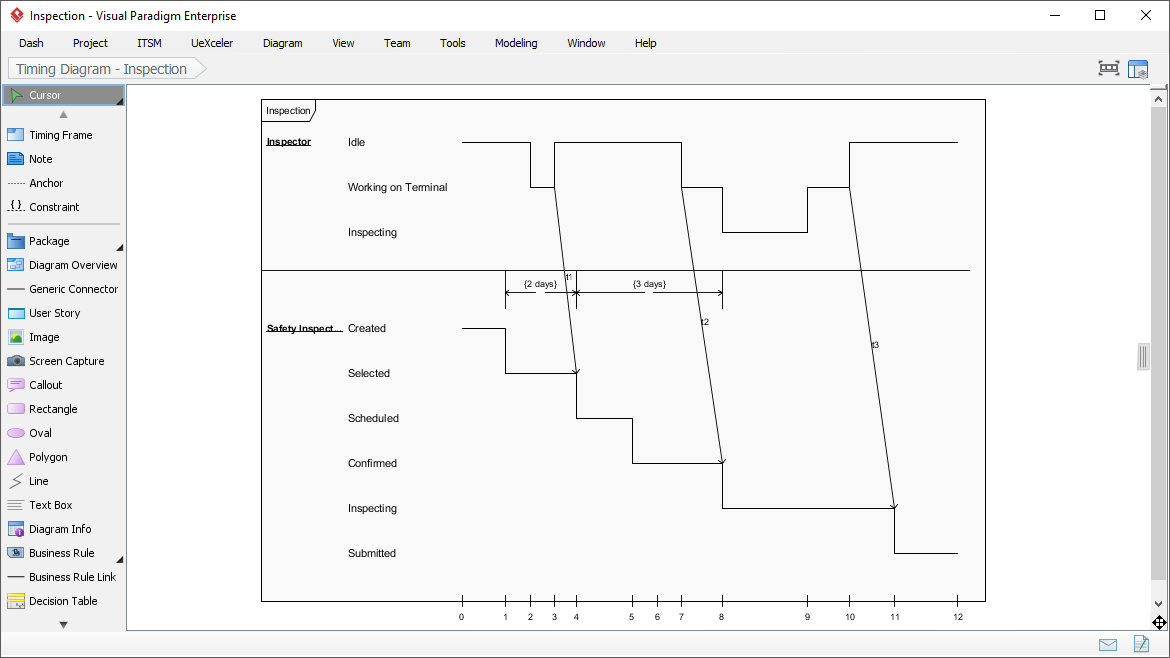
Looking at the screenshot from Visual Paradigm, we see a classic Timing Diagram setup. The diagram is divided into horizontal sections called Life Lines, representing the objects being monitored. The vertical axis represents the progression of time.
1. The Life Lines (Objects)
Each vertical bar represents the lifespan of an object. In this specific model, we have two distinct actors:
- Inspector: The top life line represents the human or automated entity performing the inspection. The states listed (Idle, Working on Terminal, Inspecting) describe the status of this actor.
- Safety Inspector… (likely a
SafetyInspectionobject): The bottom life line tracks the lifecycle of the inspection task itself, moving through states like Created, Selected, Scheduled, Confirmed, and Submitted.
2. State Changes and The Timeline
The horizontal lines connecting the vertical life lines represent the object’s state. The “steps” or “stairs” indicate a transition from one state to another. Notice the jagged lines connecting the two life lines—these are the interactions or triggers that cause the state changes.
For instance, observe the timeline starting around the 2-unit mark. The SafetyInspection object transitions from Created to Selected. Shortly after, the Inspector transitions from Idle to Working on Terminal. This visual alignment allows you to instantly see that the Inspector begins working shortly after the inspection is selected.
Mastering Constraints and Timing Values
One of the most powerful features of the Timing Diagram in Visual Paradigm is the ability to place explicit constraints on the timeline. In the diagram, you can see horizontal brackets labeled with specific durations:
- (2 days): This constraint indicates a duration between two specific time points (marked with
t1). It tells us that the interval between the first and second major event is exactly two days. - (3 days): Similarly, this indicates a duration following the previous event.
This level of granularity is impossible to capture in a standard Sequence Diagram. It allows architects to validate whether the system’s performance meets business requirements (e.g., “An inspection must be confirmed within 3 days of scheduling”).
Why Use Visual Paradigm?
Visual Paradigm offers a robust environment for creating these diagrams. The interface shown includes a rich palette on the left, allowing you to drag and drop elements like Timing Frame, Note, and Anchor. The “Cursor” tool allows for precise editing of the state lifelines, ensuring your model accurately reflects the complex logic of your system.
Summary
By utilizing Timing Diagrams, you move beyond simple logic flows and start modeling the temporal reality of your system. Whether you are managing a 2-day or 3-day inspection cycle, this tool provides the clarity needed to ensure your system is not just functional, but timely and efficient.