


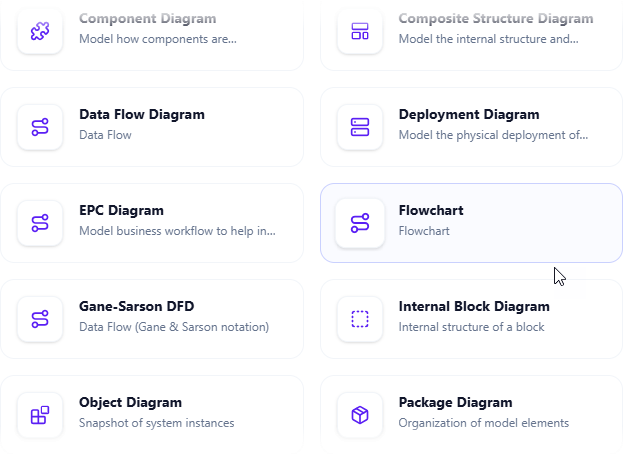
In the modern landscape of technical documentation, static images often fail to capture the complexity of business logic. They are “dead” assets that require manual updates whenever a process changes. The interface shown in the screenshot highlights a critical shift in software architecture: the move toward integrated, AI-assisted modeling. By selecting the Flowchart option within the Visual Paradigm OpenDocs workspace, users are accessing a system that bridges the gap between strategic documentation and executable logic.
This tutorial explores the underlying architecture of this integration, how the system processes your inputs, and the technical best practices for utilizing these dynamic assets.
The Architecture of OpenDocs Integration
When you select the Flowchart diagram type in the Visual Paradigm Online workspace, you are not merely inserting a blank canvas. You are invoking a specific module within the platform’s broader model-driven architecture. The system is designed to treat diagrams as first-class citizens—data structures that are linked directly to the document’s content.
The workflow typically operates on the following technical principles:
- Component Selection: The system identifies the “Flowchart” component. Unlike an EPC (Event-driven Process Chain) or a Gane-Sarson DFD (Data Flow Diagram), a standard Flowchart focuses on the control flow and logic sequence rather than just data movement.
- State Management: Upon insertion, the system creates a persistent link between the document’s DOM (Document Object Model) and the diagram’s data repository. This ensures that any edit made to the diagram in the editor reflects immediately in the report.
- AI Rendering Engine: The “AI flowchart generator” mentioned in the context utilizes natural language processing (NLP) to interpret unstructured text or strategic goals and maps them to standard UML or ISO 5807 flowchart symbols.
Step-by-Step: Inserting and Modeling Logic
To leverage this system effectively, you must understand the insertion path and the modeling syntax required to generate meaningful diagrams.
1. Accessing the Diagramming Engine
Start by navigating to your Visual Paradigm Online workspace. Whether you are building a strategic guide or a wiki page, the process begins with the Insert Menu:
- Open Your Page: Navigate to the specific document where the workflow needs to be visualized.
- Select Insert > Diagram: Locate the toolbar menu and select the Diagram option.
- Choose Flowchart: In the selection grid (as seen in the provided screenshot), click on the Flowchart card. This is distinct from the Data Flow Diagram or Deployment Diagram.
2. Modeling the Logic
Once the diagram is inserted, the AI generator or the manual editor allows you to define the logic. A robust flowchart relies on a strict hierarchy of control structures.
For a system to be “living,” the flowchart must represent:
- Terminators: Start and End points (Oval shapes).
- Processes: Actions or operations (Rectangular shapes).
- Decisions: Conditional branches where the path splits (Diamond shapes).
- Connectors: The flow lines that dictate the direction of execution.
3. The AI Generation Process
When utilizing the AI generator feature, the system parses the text surrounding your insertion point. It looks for keywords such as “if,” “then,” “while,” and “end.” It then constructs a graph theory representation of your process, ensuring that all loops and branches are closed.
Advanced Concept: Dynamic Asset Evolution
The prompt mentions that these visuals “evolve with your team’s understanding.” In technical terms, this refers to bi-directional synchronization.
In traditional tools, updating a flowchart often meant exporting a PNG and re-uploading it. In OpenDocs, the diagram is a live object. If you add a new step to the diagram, the document’s text references can be automatically updated to reflect the new complexity of the process. This is particularly useful for:
- Strategic Guides: Where high-level goals must be broken down into executable steps.
- Knowledge Bases: Where troubleshooting guides require precise conditional logic.
Common Pitfalls in Flowchart Modeling
When modeling within this system, avoid the following common errors that degrade the utility of the diagram:
- Ignoring Termination: Ensure every branch leads to a valid end point. “Orphan” lines indicate logic errors.
- Over-complicating Decisions: A diamond shape should only have two or three clear outputs (Yes/No/Else). If a decision node has too many paths, consider creating a sub-process.
- Text Density: Keep the text inside shapes concise. The AI generator prefers clear, imperative verbs (e.g., “Calculate Total” rather than “This is where the total is calculated”).
Conclusion
By integrating the AI Flowchart generator into OpenDocs, organizations transform their documentation from a static archive into a dynamic system of knowledge. The ability to insert, generate, and maintain these diagrams directly within the workspace ensures that your technical specifications remain accurate, accessible, and up-to-date.