


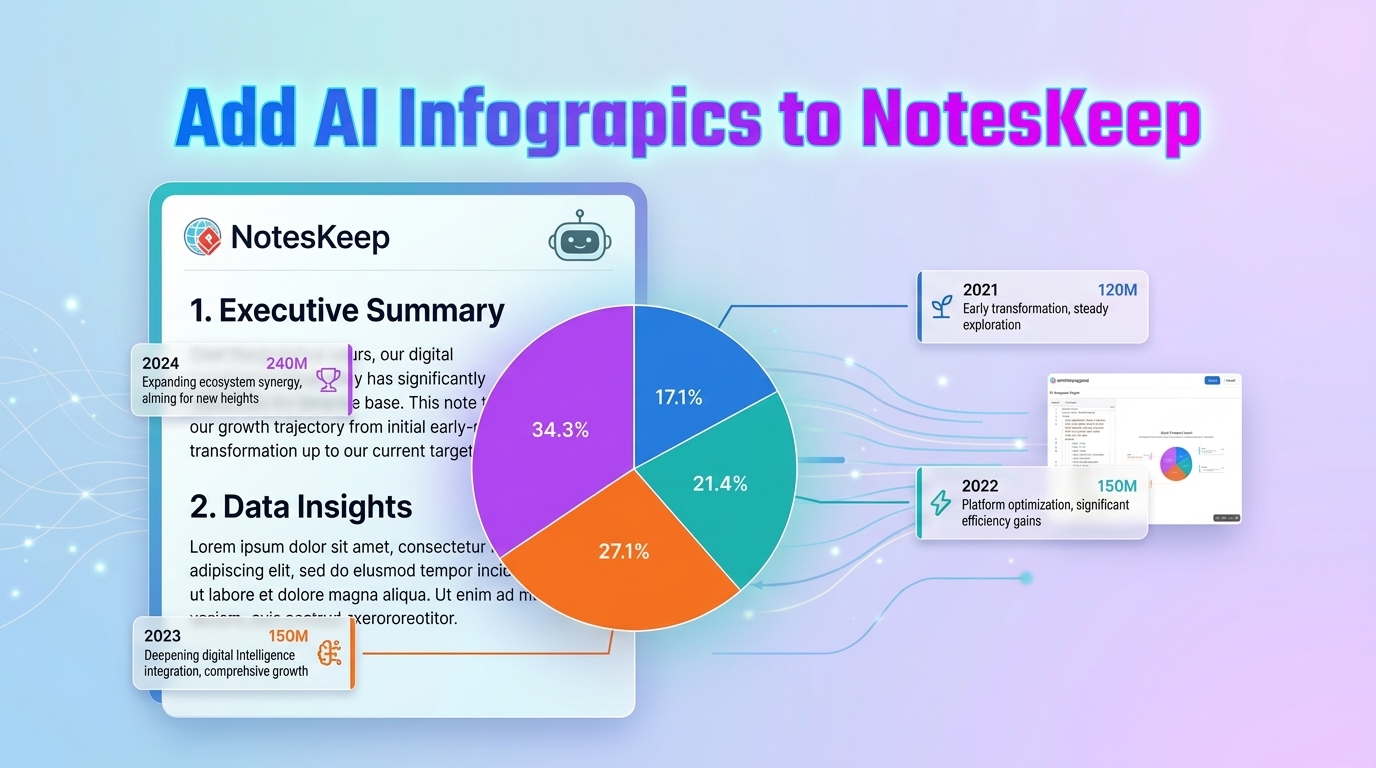
Visual Paradigm NotesKeep represents a paradigm shift in how technical teams manage documentation. By integrating AI-generated infographics directly into workspace pages, it transforms static text into dynamic, interactive visual narratives. This tutorial breaks down the underlying architecture of these AI infographics, explaining how the system converts raw text notes into structured data visualizations like the pie chart shown in the interface.
The Architecture of AI-Driven Visualization
The system functions through a three-layer architecture: Input Parsing, Intent Recognition, and Structural Mapping. Unlike traditional diagramming tools where users must manually draw shapes and lines, NotesKeep’s backend utilizes Natural Language Processing (NLP) to interpret the semantic meaning of your text.
1. Input Parsing & Entity Extraction
The process begins when the AI engine scans your workspace notes. It looks for specific entities and temporal markers. In the context of the provided image, the system identifies:
- Temporal Anchors: Years (2021, 2022, 2023, 2024) serve as the primary dimension for the chart.
- Quantitative Metrics: Numerical values (e.g., “120M”, “150M”) are extracted to determine the relative size of the data segments.
- Descriptive Labels: Text strings describing the events (e.g., “Early transformation”) are mapped as the legend or tooltips for each segment.
2. Intent Recognition
Once entities are extracted, the system performs Intent Recognition to determine the appropriate visualization format. It analyzes the relationship between the data points. Since the input data represents a breakdown of a whole (likely a cumulative growth or market share) over distinct time periods, the AI selects a Pie Chart or Donut Chart topology.
If the data were comparative (e.g., “Q1 vs Q2 Revenue”), the AI would have instead selected a Bar Chart. The selection logic is governed by the ratio of data points to their values:
IF (data_points.count > 1) AND (data_points.sum == total_value) THEN
    SELECT Visualization = "Pie Chart"
ELSE IF (data_points.category == "time_series") AND (metric == "growth") THEN
    SELECT Visualization = "Line Chart"
ELSE
    SELECT Visualization = "Flow Diagram"
END IF
3. Structural Mapping & Layout
The final stage involves mapping the extracted entities to the visual canvas. The system applies a layout algorithm to distribute the segments. In the example image, the AI places the largest segment (34.3%) prominently and aligns the annotation boxes (2021-2024) around the chart to create a cohesive “Contextual Infographic.”
Step-by-Step: From Text to Diagram
To replicate this functionality, users typically follow a structured workflow within the Visual Paradigm environment:
- Raw Input: The user types or pastes unstructured text, such as meeting minutes or a rough project timeline.
- AI Trigger: Using the “AI Diagram Generator” command, the user highlights the text block.
- Template Selection: The AI suggests a template (e.g., “200+ Professional Formats”). The user selects a format that matches the data density.
- Render & Edit: The diagram is rendered. Because it is “editable,” the user can manually tweak the colors or reposition the connector lines if the AI’s initial layout does not perfectly suit the narrative flow.
Technical Best Practices for Documentation
When utilizing AI infographics for system architecture or project management, consider the following best practices:
- Data Granularity: Ensure your source notes contain precise numerical values. AI models struggle to estimate percentages from vague descriptors like “a lot” or “most of the time.”
- Contextual Linking: The power of NotesKeep lies in the link between the diagram and the text. Keep your raw notes concise to allow the AI to generate clean, readable labels rather than long paragraphs inside chart segments.
- Centralization: As mentioned in the platform’s core philosophy, use these infographics as the “Source of Truth.” Avoid maintaining separate Excel sheets for data; let the embedded diagram be the single point of reference.
By understanding the mechanics behind these AI tools, teams can move beyond simple diagramming to creating truly intelligent, context-aware documentation systems.