


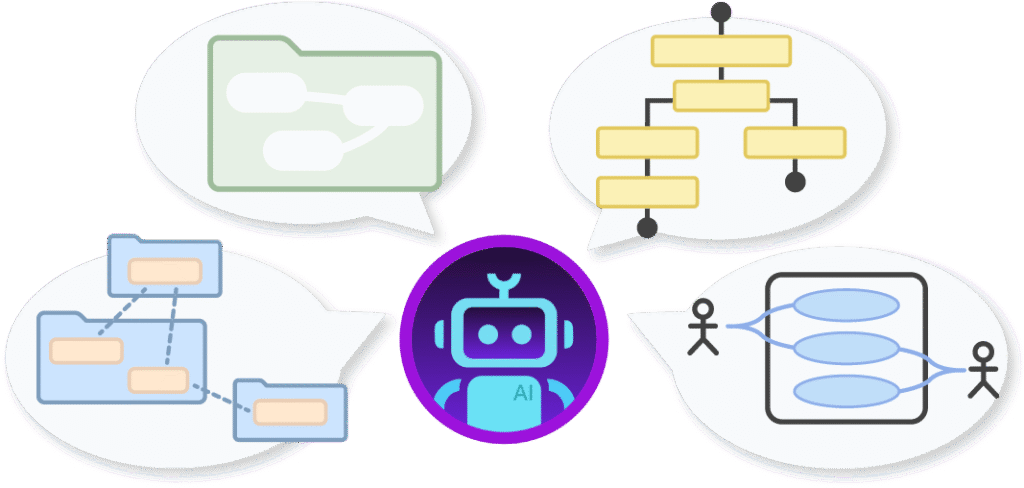
In the modern landscape of project management, the gap between a raw idea and a structured schedule has been bridged by conversational AI. This tutorial explores the architecture and modeling concepts behind an AI-assisted PERT (Program Evaluation and Review Technique) Chart system, specifically utilizing the capabilities of tools like Visual Paradigm. By transforming unstructured text into complex dependency graphs, this technology allows project managers to move from static planning to dynamic, interactive scheduling.
The Architecture of AI-Assisted Modeling
The system described operates on a “Text-to-Model” architecture. Instead of manually dragging and dropping nodes on a canvas, the user interacts with a chatbot interface. The underlying logic follows a specific pipeline:
- Input Parsing: The system ingests natural language descriptions of a project timeline.
- Dependency Extraction: It identifies key activities, milestones, and the logical relationships (dependencies) between them.
- Graph Construction: The AI constructs a directed graph where nodes represent events or tasks, and edges represent the flow and duration.
- Visualization Rendering: The data is rendered into a clean, visual PERT chart.
This approach removes the complexity of manual mapping, allowing the project manager to focus on the logic of the schedule rather than the geometry of the diagram.
Understanding the PERT Chart Model
A PERT chart is a statistical tool used in project management to analyze and represent the tasks involved in completing a given project. In the context of this AI tool, we are looking at a variation of a network diagram.
Key Modeling Concepts
- Nodes (Events): These represent specific points in time, such as the start or completion of a task.
- Edges (Activities): These represent the work or time required to move from one event to the next.
- Dependencies: The critical logical connections. A task cannot start until the previous task is finished.
- Durations: The estimated time required to complete an activity.
Interactive Refinement
One of the most powerful features of this AI system is its ability to handle iterative changes. Traditional diagrams are static; if you change a duration, you must manually redraw the chart and recalculate the critical path. The AI chatbot, however, acts as a dynamic modeler.
Consider the following interaction flow where the project scope changes:
User: "We need to extend the 'Design Phase' by 3 days."
AI: "Understood. I have updated the Design Phase duration to 10 days. Note that this increases the total project duration by 3 days and shifts the Critical Path to include this task."

User: "What if we run 'Testing' and 'Documentation' in parallel?"
AI: "I will remove the dependency link between 'Testing' and 'Documentation'. This creates a parallel path, potentially reducing the overall timeline by 2 days, provided the Testing team has sufficient resources."
Step-by-Step: Creating a PERT Chart with AI
To leverage this technology effectively, follow these modeling steps:
Step 1: Define the Scope
Start by providing a high-level overview of the project. Be explicit about the start and end conditions.
Step 2: List Key Activities
Input the tasks sequentially. The AI will attempt to infer the logical order. For example: “First, we gather requirements. Then, we design the architecture. Finally, we write the code.”
Step 3: Validate Dependencies
Review the generated chart. The AI may make assumptions about dependencies. You must validate these. For instance, you might need to specify that “Testing” cannot start until “Design” AND “Coding” are both complete (a merge dependency).
Step 4: Iterative Exploration
Use the chat interface to “what-if” scenarios. Ask the AI to simulate delays or resource shortages. This helps in identifying the Critical Path—the longest sequence of tasks that determines the shortest possible time to complete the project.
Benefits of AI-Driven Scheduling
The transition from manual drawing to AI-assisted modeling offers significant advantages:
- Speed and Efficiency: Mapping out complex dependencies is instantaneous compared to manual CAD or drawing.
- Risk Mitigation: The AI helps uncover bottlenecks early by analyzing the network logic.
- Agility: When project requirements change, the chart updates instantly, providing immediate feedback on schedule impacts.
- Clarity: The visual output is clean and professional, supporting better team discussions.
Conclusion
By integrating AI into the modeling process, tools like Visual Paradigm transform the PERT chart from a static document into a living, breathing part of the project management lifecycle. It empowers teams to experiment with scheduling logic, validate sequences, and maintain clarity in even the most complex projects.