


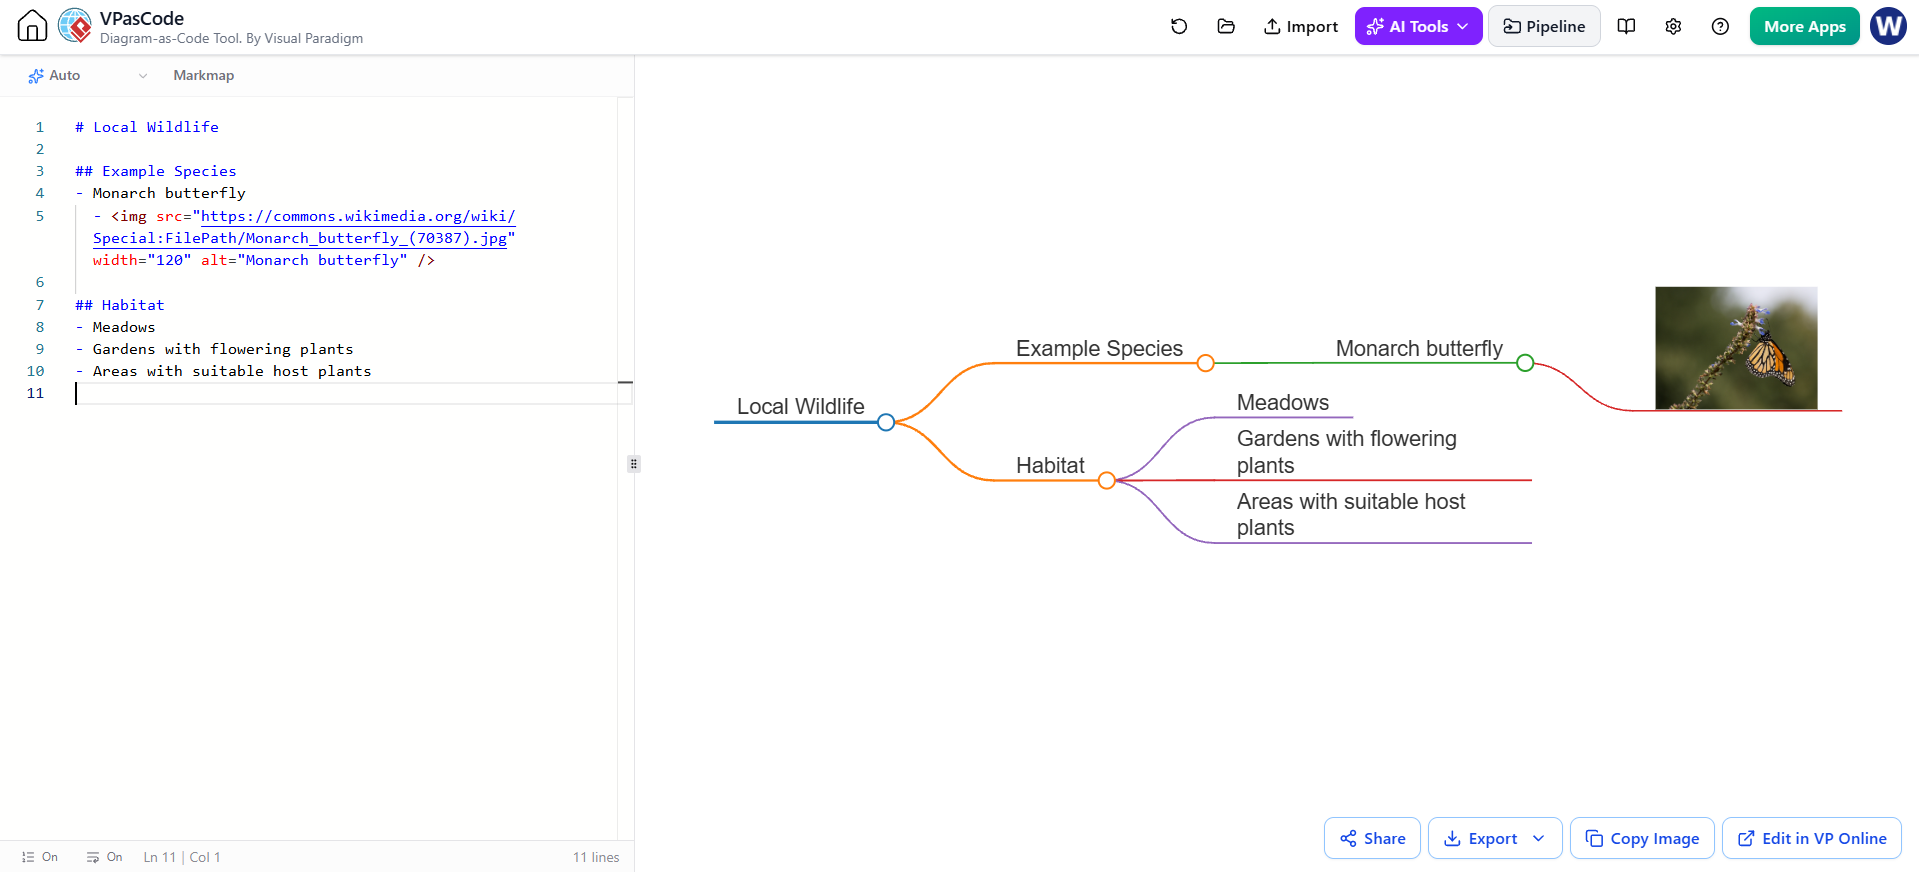
The evolution of diagramming has shifted from manual drawing to code-first generation, allowing technical authors to maintain diagrams as text. Visual Paradigm’s VPasCode tool exemplifies this shift by combining a text editor with a live diagram preview, specifically supporting Markmap syntax. This tutorial explores how to leverage this tool to create interactive, hierarchical mind maps using simple Markdown formatting, focusing on structure, embedding media, and the workflow for AI-assisted design.
Understanding Markmap Syntax and Hierarchy
Markmap relies on standard Markdown syntax to define the structure of a map. The core concept is that headings ( # ) represent the nodes of the tree, while indentation defines the parent-child relationships.
In a typical Markmap document, the hierarchy is strictly defined by the number of hash symbols:
- H1 (#): The root node, representing the central topic of the map.
- H2 (##): The primary branches or main categories.
- H3 (###): Sub-categories or deeper levels of detail.
The following example demonstrates a basic structure for a map about Local Wildlife:
# Local Wildlife

## Example Species
- Monarch butterfly

## Habitat
- Meadows
- Gardens with flowering plants
In the VPasCode interface, this text is parsed in real-time. The H1 node “Local Wildlife” appears as the central hub, while “Example Species” and “Habitat” branch out as immediate children. The list items under these headers then expand further into leaf nodes.
Enhancing Visuals with Embedded Media
One of the most powerful features of the Markmap renderer is the ability to embed HTML within Markdown list items. This allows you to attach images, videos, or interactive elements directly to specific nodes, enriching the data visualization.
To embed an image, you must use the standard HTML <img> tag within a list item. The syntax requires a direct link to the image file and can include attributes to control size and accessibility.
## Example Species
- Monarch butterfly
  - <img src="https://commons.wikimedia.org/wiki/Special:FilePath/Monarch_butterfly_(70387).jpg" width="120" alt="Monarch butterfly" />
Technical Note: Ensure the image URL points directly to the file (ending in .jpg, .png, etc.). If the image fails to render, check if the source permits hotlinking or if the specific renderer used by VPasCode has restrictions on external HTML content.
Design Principles for Effective Maps
Creating a map that is both informative and easy to scan requires adherence to specific design principles. Unlike a standard document, a mind map is a visual hierarchy that should be consumed quickly.
1. Keep Nodes Short
Labels in a tree diagram should be concise. If a node contains a lengthy explanation, table, or code block, it can disrupt the visual flow. The best practice is to use the node label as a keyword or short phrase, and place detailed content in notes or deeper sub-branches.
2. Consistent Hierarchy
Main branches should represent categories at roughly the same level of abstraction. Avoid mixing high-level concepts with granular details on the same tier. For example, “Meadows” and “Gardens” are both types of habitats and should sit at the same level, rather than one being a child of the other.
3. Purposeful Formatting
Use Markdown formatting (bolding, italics, inline code) sparingly and with intent. Bold text can highlight key terms, while inline code can distinguish specific identifiers. If every label is bolded, the emphasis is lost.
The VPasCode Workflow
Visual Paradigm’s VPasCode streamlines the creation process by offering a split-pane view: a text editor on the left and a live rendering canvas on the right.
Step 1: Drafting with AI
Start by defining your outline. You can use an AI assistant to generate a Markmap-ready Markdown outline. When prompting the AI, specify the audience, main branches, and desired level of detail.
"Create a Markmap-ready Markdown outline explaining advanced Markmap features to a beginner. Include branches for hierarchy, formatting, notes, code, math, folding, images, frontmatter, and troubleshooting. Use concise labels and include a small example under each branch. Return Markdown only."Step 2: Import and Review
Paste the generated Markdown into the VPasCode editor. The tool will immediately parse the text and render the initial diagram. Check that the output begins with a single root heading and that the indentation correctly places bullets under their parents.
Step 3: Refine and Preview
Use the live preview to iterate on the design. Try expanding and collapsing branches to ensure the map handles depth correctly. Check if special features like images, math, or notes display as intended. If a feature isn’t showing, test it in a small, isolated document to distinguish between a Markdown syntax error and a renderer limitation.
Step 4: Test Frontmatter
Frontmatter (YAML blocks at the top of the file) allows you to customize the appearance and behavior of the map. Add this block outside of any code fences.
---
theme: default
backgroundColor: "#ffffff"
---
Change one setting at a time and compare the preview. If the map looks unchanged, the renderer may not support that specific option, or the setting might be matching the default values.
Conclusion
The combination of Markdown syntax and the VPasCode rendering engine offers a powerful way to create technical diagrams. By treating the diagram as code, you gain version control, AI-assisted generation, and precise formatting control. Whether you are documenting complex workflows or organizing study materials, the ability to refine your map through text editing ensures a clean, professional, and scalable output.