


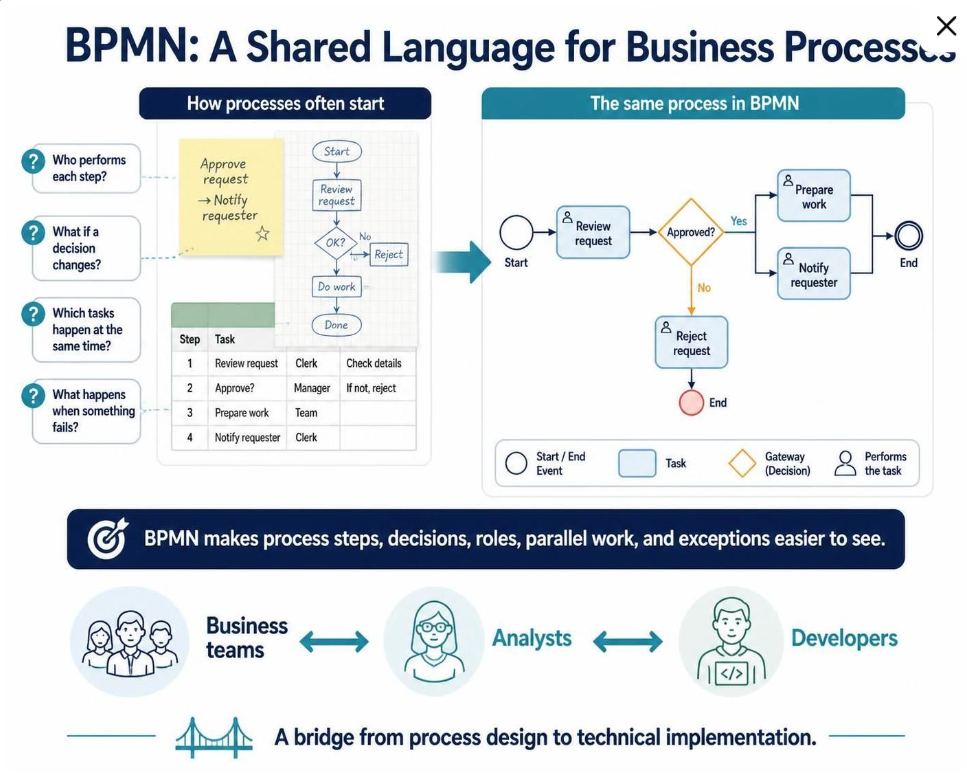
Business processes are often described in words, spreadsheets, or informal flowcharts. While these formats can be easy to start with, they frequently leave critical questions unanswered: Who performs each step? What happens when a decision goes another way? Which tasks happen at the same time? How does the process respond when something fails?
Business Process Model and Notation (BPMN) provides a shared visual language for describing processes. Its flowchart-like diagrams are intended to be understandable to business stakeholders while also being precise enough to support technical implementation. This makes BPMN useful as a bridge between people who design, manage, and automate work.
The Challenge of Informal Process Descriptions
Before diving into BPMN, it is essential to understand the limitations of traditional process documentation methods. The image highlights a common scenario where a process is described via a sticky note, a simple flowchart, and a spreadsheet.
- Informal Flowcharts: Often lack standard symbols, making it difficult to distinguish between a decision and a task.
- Spreadsheets: While great for listing data, they struggle to show the flow of control or parallel execution.
- Sticky Notes: Excellent for brainstorming, but they lack the structure required for automation or complex logic.
The core problem is ambiguity. Without a standard notation, a “Review Request” step might mean different things to a business analyst and a software developer. BPMN solves this by defining a strict grammar for process modeling.
Decoding the BPMN Diagram
The “same process in BPMN” section of the image illustrates how to translate that ambiguous information into a rigorous model. Let’s break down the components shown in the diagram step-by-step.
1. Events: The Start and End Points
Events are depicted as circles. They define when something happens, not what happens.
- Start Event (Green Circle): The process is triggered here. In this case, a request has been made.
- End Event (Red Circle): The process concludes. There are two endings here: a successful completion or a rejection.
2. Tasks: The Work Being Done
Tasks are represented by rectangles with rounded corners. This is where the actual work occurs. The icon of a person inside the rectangle indicates the Actor or the role responsible for that task.
- Review Request: A generic task performed by a role (likely a manager).
- Prepare Work: A task performed by a different role (likely a team member).
- Notify Requester: A communication task.
- Reject Request: A specific task handling the failure path.
3. Gateways: Decisions and Logic
This is where the “formulas” of the process are written. The diamond shape represents a Gateway.
- Exclusive Gateway (Diamond): In the diagram, the “Approved?” diamond represents a decision point. The process flows in one direction or another, but not both. The lines labeled “Yes” and “No” are called Sequence Flows.
- Parallel Gateway (Not explicitly shown here, but implied by the structure): If the “Yes” path split into two boxes side-by-side, it would mean those tasks happen simultaneously.
4. Sequence Flows: The Roadmap
The arrows connecting the shapes dictate the order of operations. Notice how the BPMN diagram clearly handles the “What if it goes wrong?” question. In a spreadsheet, this is often buried in a footnote. In BPMN, the “No” path is a visible, mandatory step leading to the Reject Request task.
Building the Bridge: From Business to Development
The bottom section of the infographic illustrates the “Bridge” concept. BPMN is the Rosetta Stone of the enterprise.
- Business Teams: They define the “What” and “Why” using the visual language.
- Analysts: They translate business requirements into the formal BPMN syntax.
- Developers: They read the precise BPMN model to configure workflows, write code, or set up automation rules.
By using a shared language, you eliminate the “telephone game” where requirements get lost or misinterpreted during the handoff from business to IT.
Why Precision Matters
The image specifically asks: “Which tasks happen at the same time?” In a linear spreadsheet list (Step 1, Step 2, Step 3), parallelism is impossible to visualize. However, in a BPMN diagram, if you see two tasks branching out from a gateway and merging back in, it immediately signals to the developer that these processes can run in parallel, significantly speeding up the overall workflow.
Conclusion
Transitioning from informal notes to BPMN is not just about drawing better pictures; it is about enforcing clarity. By defining your Start events, Tasks, and Gateways explicitly, you create a blueprint that is robust enough to handle edge cases, parallel work, and complex decision logic.