


In the world of Business Process Model and Notation (BPMN), clarity is king. A process diagram is not just a map of activities; it is a blueprint of information flow. One of the most critical yet often misunderstood elements of this blueprint is the Data Association.
This tutorial explores the nuances of Data Association within the context of Visual Paradigm’s modeling environment. We will move beyond simple flowcharts to understand how to explicitly define the lifecycle of data objects—specifically how documents like “Nomination Forms” are consumed and produced across a complex workflow.
Understanding the Role of Data Association
When you look at a BPMN diagram, the most obvious connectors are the Sequence Flows. These arrows dictate the chronological order of operations: “First this happens, then that happens.” However, Sequence Flows do not tell you what is being processed.
This is where Data Associations come into play. They represent the transfer of information between the process logic (Activities) and the data storage or objects (Data Objects). In Visual Paradigm, these are often visualized as dashed lines with arrows, providing a distinct separation between the control flow (the sequence) and the data flow (the content).
Input vs. Output Associations
To model a process accurately, you must distinguish between data that is required to start a task and data that is generated by a task.
- Input Data Association: This is visualized as an arrow pointing from a Data Object to an Activity. It signifies that the task requires specific information to execute. For example, a “Collect Completed Forms” activity cannot begin until the “Nomination Form” data object exists and is available.
- Output Data Association: Conversely, this arrow points from an Activity to a Data Object. This indicates that the task produces or updates data. For instance, the “Send Nomination Form” activity produces the actual form document.
Case Study: The Nomination Process
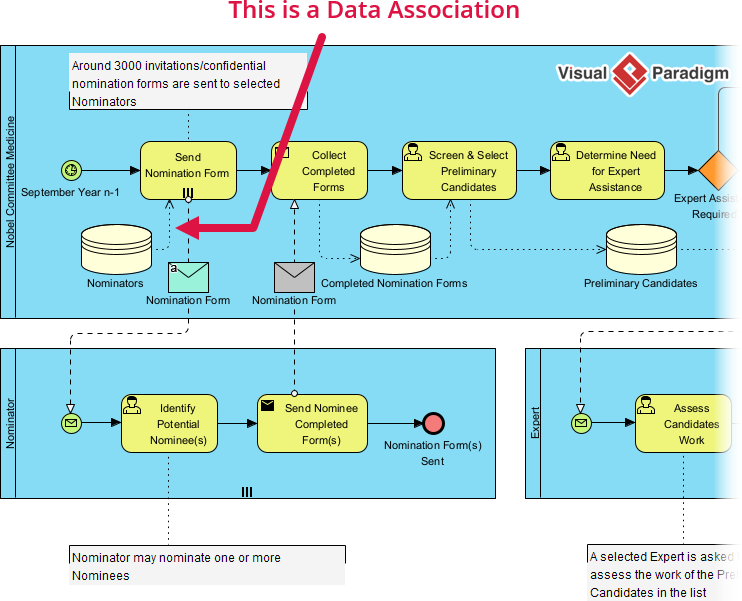
Let’s analyze the provided diagram to see these concepts in action. The diagram depicts a “Nobel Committee Medicine” process, which involves a rigorous selection procedure. The visual cues here are vital for understanding how data moves through the system.
1. The Input Requirement
Observe the activity labeled Collect Completed Forms. You will see a dashed line connecting a Data Object labeled “Nomination Form” to this activity. This is an Input Data Association. It tells the system that this specific activity needs the data contained within the “Nomination Form” object to function.
2. The Output Generation
Now, look at the activity Send Nomination Form. The diagram shows a dashed line originating from this task and pointing toward the “Nomination Form” Data Object (or a database representing it). This is an Output Data Association. The act of sending the form generates the data artifact.
3. The Physical vs. Logical Distinction
A subtle but important feature in the diagram is the presence of Data Objects represented as cylinders (databases) or envelopes (documents). In Visual Paradigm, you can model the logical data (what the process needs) and the physical data (where it is stored).
Notice the annotation in the diagram: “Around 3000 invitations/confidential nomination forms are sent…”. This text box provides context to the Output Data Association. It explains that the “Send Nomination Form” activity results in the creation of roughly 3000 physical or digital instances of data, which are then stored in the “Nominators” database.
Why This Separation Matters
Why do we need separate lines for data when the Sequence Flow already connects everything? The answer lies in diagram readability and technical precision.
If we tried to show data flow using only Sequence Flows, the diagram would become a tangled mess of arrows crossing over one another. By using Data Associations, Visual Paradim allows you to maintain a clean “Control Flow” lane (the main sequence of steps) while keeping the “Data Flow” distinct.
This separation is crucial for:
- Performance Analysis: It helps identify bottlenecks where data is being created faster than it can be processed.
- System Integration: When developers implement this process, they can clearly see which database tables are being read (Input) and which are being written to (Output).
- Compliance: In regulated industries, it is often required to explicitly document which data objects are touched by which regulatory steps.
Conclusion
Understanding Data Association transforms a BPMN diagram from a simple flowchart into a powerful system specification. By clearly distinguishing between Input and Output associations, you ensure that every step in your process—whether it is identifying a nominee or assessing their work—is properly supported by the necessary data artifacts.