


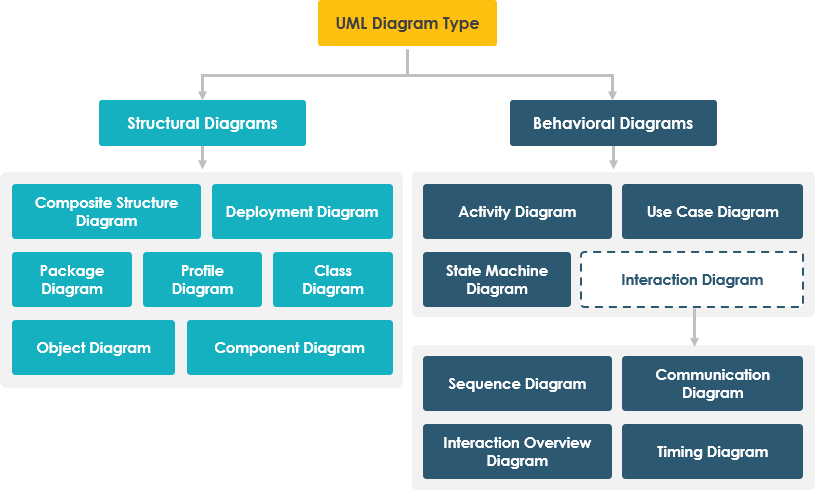
Designing robust software architecture begins with the ability to visualize complex systems. Whether you are a system architect mapping out a cloud deployment or a developer tracing the lifecycle of a specific object, the Unified Modeling Language (UML) provides the standard notation to make your thinking visible.
This tutorial explores the 14 standard UML 2.x diagram types, categorizing them into Structural and Behavioral families. We will walk through when to use each type, how they relate to one another, and how to select the right tool for the job—from visual modeling in Visual Paradigm to text-based modeling with VPasCode.
1. The Golden Rule: Start with the Question
Before opening your modeling tool, the most critical step is defining the purpose of your diagram. A common pitfall is attempting to cram every aspect of a system into a single, massive diagram. Instead, focus on specific questions that the diagram must answer.
- What can users do?
Use a Use Case Diagram to define scope and actor goals. - What happens during a scenario?
Use a Sequence or Activity Diagram to trace workflows and logic flows. - What concepts make up the domain?
Use a Class Diagram to model the static structure and relationships. - How is software divided into parts?
Use Component and Deployment Diagrams to map code to hardware. - How does an object change over time?
Use a State Machine Diagram to track state transitions.
Pro Tip: Prefer several focused diagrams over one crowded overview. A diagram that tries to answer every question at once usually becomes unreadable.
2. Structural Diagrams: The “Nouns” of the System
Structural diagrams describe the static aspects of the system. They represent the “nouns”—the architecture, components, and data structures that make up the software. These diagrams are the blueprint of your system.
Class and Object Diagrams
The Class Diagram is the cornerstone of object-oriented design. It displays the classes, their attributes, operations (methods), and the relationships (associations, inheritances) between them. It answers the question: “What are the parts of this system?”
Conversely, the Object Diagram provides a snapshot of specific instances of these classes at a particular moment in time. It is essentially a “photo” of the data structure, showing actual links between objects.
Component and Deployment Diagrams
Once the classes are defined, we look at the physical and logical build. The Component Diagram groups classes into deployable units (like libraries or modules) and defines their interfaces and dependencies.
The Deployment Diagram maps these software artifacts onto the physical hardware. It shows nodes (servers, devices) and the communication paths between them, critical for understanding your system’s infrastructure.
Other Structural Views
- Composite Structure: Used to show the internal parts, ports, and connectors inside a complex classifier.
- Package Diagram: Shows how model elements are grouped and how packages depend on one another.
- Profile Diagram: Allows you to extend UML with your own stereotypes and tagged values.
3. Behavioral Diagrams: The “Verbs” of the System
While structural diagrams show the parts, behavioral diagrams show the actions. They describe the “verbs”—how the system behaves, reacts to events, and processes data.
Use Case and Activity Diagrams
The Use Case Diagram is often the first diagram created in a project. It captures the functional requirements by showing the relationship between Actors (users or external systems) and the Use Cases (goals) they achieve.
The Activity Diagram is the closest equivalent to a flowchart. It is used to model the workflow of the system, showing decisions, parallel processing, and the flow of control from one activity to another.
State Machine Diagrams
Not all behavior is linear. Complex objects, like a “Shopping Cart” or a “Server,” change states based on events. A State Machine Diagram captures the lifecycle of a single object, defining its states (e.g., Idle, Active, Error) and the event-triggered transitions between them.
4. Interaction Diagrams: The Conversation
Interaction diagrams are a specialized subset of behavioral diagrams that focus on the exchange of messages between objects or actors. They are crucial for understanding how different parts of the system communicate.
Sequence and Communication Diagrams
The Sequence Diagram is the most popular interaction diagram. It emphasizes time, showing messages exchanged between participants in a vertical, chronological order. It is ideal for debugging specific method calls.
The Communication Diagram (formerly Collaboration Diagram) emphasizes the network structure. It shows how objects are linked and how messages flow between them, but without the strict vertical time axis of a sequence diagram.
Timing and Interaction Overview
- Timing Diagram: Focuses strictly on the time scale, showing state or value changes over precise time intervals.
- Interaction Overview Diagram: Acts as a high-level flowchart that connects multiple interaction scenarios (like Sequence diagrams) together.
5. Tooling: Visual Paradigm + VPasCode
Modern modeling requires flexibility. While the UML standard remains constant, the tools used to create these diagrams are evolving.
- Visual Paradigm (Visual Modeling): An industry-standard tool that provides a drag-and-drop interface for drawing all 14 diagram types. It supports advanced features like AI-assisted modeling and reverse engineering.
- VPasCode (Text-Based Modeling): For those who prefer coding over clicking, VPasCode allows you to define UML diagrams using code. This is excellent for version control and rapid prototyping.
Example: VPasCode for a Simple Use Case
Using a text-based approach, you can define a system scope quickly. Below is an example of how to define a Use Case diagram in VPasCode syntax:
@usecase "Online Shopping System" {
    actor Customer
    actor Administrator

    Customer -- "Place Order" UseCase1
    Customer -- "View Cart" UseCase2
    Administrator -- "Manage Inventory" UseCase3

    UseCase1 ..> UseCase2 : <>
}
Summary
You rarely need all 14 UML diagram types for a single project. For many application designs, a focused set is sufficient:
- Use Case for requirements.
- Class for core data structure.
- Sequence for key logic flows.
- Activity for complex workflows.
- Component/Deployment for system architecture.
By understanding the distinction between Structural, Behavioral, and Interaction diagrams, you can choose the right visual language to communicate your system architecture effectively.